overview
Here we will explain a sample that allows you to easily monitor PLC information via Web.
The easiest way to meet these needs is to use the Tag report action to output HTML files in real time. In addition to simply displaying values, it is also possible to link with JavaScript by skillfully arranging mark strings, or to replace images according to values. By placing the HTML file output by this function on a HTTP server such as IIS, it becomes possible to view the monitoring screen via Web.
Action used: Tag report action
(Example of screen display in Web browser)

|
The displayed screen is drawn using HTML code, so you can create a monitoring screen that is not dependent on the OS. For example, you can monitor from tablet devices of various manufacturers. |
|
By combining it with the FTP transfer action, you can dynamically transfer the HTML file output by the Tag report action to a HTTP server such as IIS. |
Download the sample
There are two examples provided in the example shown on this page.
■ Sample of embedding tags in HTML
■The above dynamic display update sample (using JavaScript)
In these samples, the display of real values is implemented in the following way. For details, please refer to the explanation on this page.
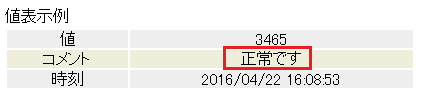
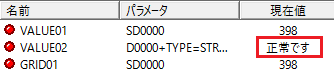
▪Value display example
Displays the real value. Also includes information such as comments and time.
▪Grid Example
Displays the current value and the total value in the grid. The total value is calculated by the application.
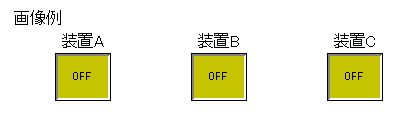
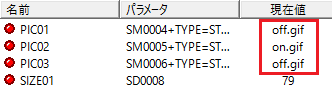
▪Example images
Two images,
on.gif and off.gif, are used to display bit information pictorially.
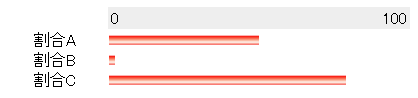
▪Size linkage example
Works in conjunction with the width property of
redbar.gif to display numerical values in a bar graph image.
Operation check
Load the sample server configuration file from FA-Server and bring the application online (yellow arrow).
After going online, check that the HTML file specified in the report action has been created in the specified folder, and try viewing it in the Web browser.
Setup Procedure
Tag configuration
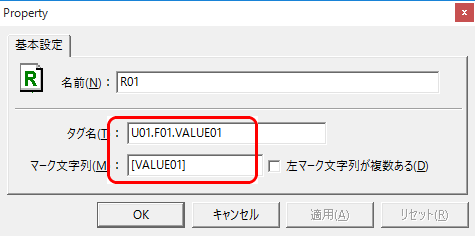
1.Set tags.
The following tags are set in this sample:
Tag Name |
Mark string |
the purpose |
U01.F01.VALUE01 |
[VALUE01] |
value |
U01.F01.VALUE02 |
[VALUE02] |
comment |
U01.F01.GRID01 |
[GRID01] |
Grid Example - Work A Work A |
U01.F01.GRID02 |
[GRID02] |
Grid example - Work B Work A |
U01.F01.GRID03 |
[GRID03] |
Grid example - Work C Work A |
U01.F01.GRID04 |
[GRID04] |
Grid example - Work A Work B |
U01.F01.GRID05 |
[GRID05] |
Grid Example - Work B Work B |
U01.F01.GRID06 |
[GRID06] |
Grid example - Work C Work B |
U01.F01.GRID07 |
[GRID07] |
Grid example - Work A Work C |
U01.F01.GRID08 |
[GRID08] |
Grid example - Work B Work C |
U01.F01.GRID09 |
[GRID09] |
Grid Example-Work CWork C |
U01.F01.PIC01 |
[PIC01] |
Screen example - Device A |
U01.F01.PIC02 |
[PIC02] |
Screen example - Device B |
U01.F01.PIC03 |
[PIC03] |
Screen example - Device C |
U01.F01.SIZE01 |
--- |
Size Linkage Example - Ratio A |
U01.F01.SIZE02 |
--- |
Size Linkage Example - Ratio B |
U01.F01.SIZE03 |
--- |
Size linkage example - ratio C |
U02.F01.VALUE03 |
[VALUE03] |
time |
U02.F01.TOTAL01 |
[TOTAL01] |
Grid Example - Total of Work A |
U02.F01.TOTAL02 |
[TOTAL02] |
Grid Example - Total of Work B |
U02.F01.TOTAL03 |
[TOTAL03] |
Grid Example - Total of Work C |
U02.F01.SIZE01 |
[SIZE01] |
Size Linkage Example - Percentage A Pixel Conversion Value |
U02.F01.SIZE02 |
[SIZE02] |
Size Linkage Example - Percentage B Pixel Conversion Value |
U02.F01.SIZE03 |
[SIZE03] |
Size linkage example - ratio C pixel conversion value |
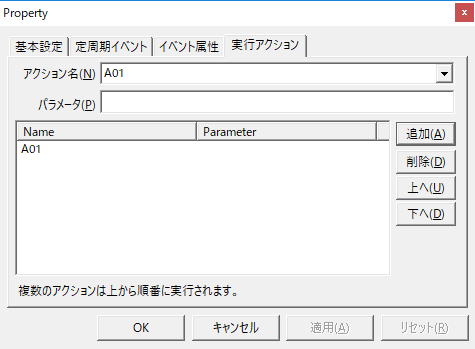
Action Settings
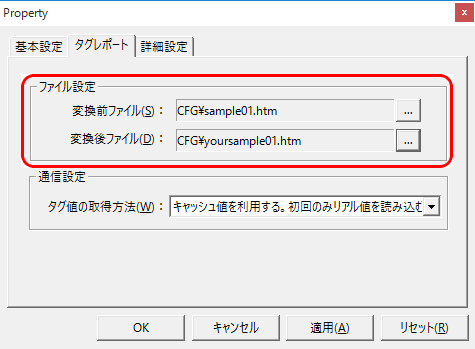
1.Tag reportRegister action "A01".
Tag reportPlease check the pre-conversion file name and post-conversion file name of the action.
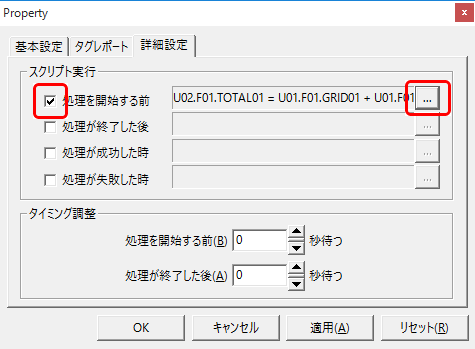
2.Script settings for "Before processing begins" in "Advanced Settings"
In this sample, the script before the action is executed is used to calculate the total value of the grid and the pixel equivalent value of the bar graph to be displayed on the screen, and store them in the tag for display.
(Advanced tab)
(Script Editor)
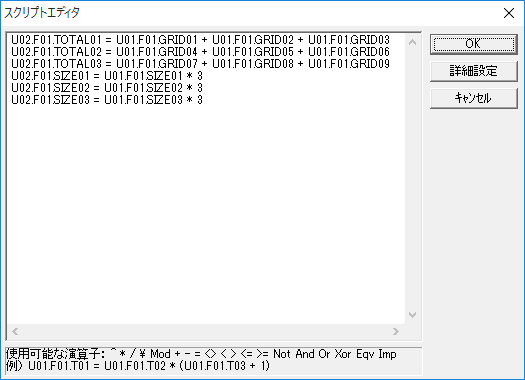
The above code writes the following script:
U02.F01.TOTAL01 = U01.F01.GRID01 + U01.F01.GRID02 + U01.F01.GRID03 U02.F01.TOTAL02 = U01.F01.GRID04 + U01.F01.GRID05 + U01.F01.GRID06 U02.F01.TOTAL03 = U01.F01.GRID07 + U01.F01.GRID08 + U01.F01.GRID09 U02.F01.SIZE01 = U01.F01.SIZE01 * 3 U02.F01.SIZE02 = U01.F01.SIZE02 * 3 U02.F01.SIZE03 = U01.F01.SIZE03 * 3 |
3.Tag reportAction field settings
Tag reportAdd a field to the action to map the tag name to the mark string.
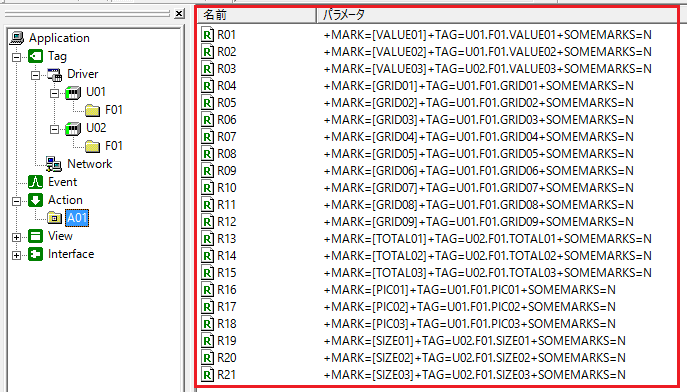
(field setting example)
Event Settings
1.Create a Periodic event to perform the action.
This sample creates a report file every 10 seconds. Set the execution action to "A01".
* By checking "Generate the first event immediately", "A01" will be executed immediately after going online without waiting 10 seconds.
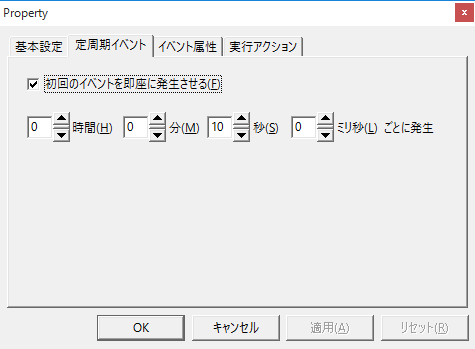
Set the execution action to "A01".
Commentary
Displaying comments
Screen Display
HTML (excerpt)
<TR> | Comments |
To display a comment, you need to create a tag for the comment. In this sample, "U01.F01.VALUE02" is used as the comment tag, and the string of this tag is embedded in [VALUE02] in HTML. This tag is configured to be converted to the corresponding string according to the PLC value using the Tag Filter function "Refer to table file and convert to numeric or string".
PLC values |
Tag value (conversion result by filter is stored) |
0 |
Normal |
1 |
Something went wrong with the pump |
2 |
There was an abnormality in the pressure |
3 |
An abnormality occurred in the rotation speed. |
About replacing images
Screen Display
HTML (excerpt)
<TR> <TD align="center"><IMG src="[PIC01]" width="56" height="48" border="0"></TD> <TD align="center"><IMG src="[PIC02]" width="56" height="48" border="0"></TD> <TD align="center"><IMG src="[PIC03]" width="56" height="48" border="0"></TD> </TR> |
The process of replacing image files according to the current value of PLC is implemented using the same method as the comment display above (string conversion using a tag filter).
When the value of PLC is ON, it will become "on.gif", and when the value of OFF is ON, it will become "off.gif", and it will be embedded in HTML.
PLC values |
Tag value (conversion result by filter is stored) |
OFF (FALSE) |
off.gif |
ON (TRUE) |
on.gif |
About the bar graph display
Screen Display
Excerpt from HTML
<TR> | Ratio A | Ratio B | Ratio C |
In the above, a bar graph is displayed by embedding the tag value for the width (width) of the image file to be displayed as a bar graph.