About the Script Debugger
When a script does not work as expected, it is very useful to be able to check the variable values and operations while executing the script line by line. FA-Panel provides a powerful tool called "Script Debugger" to assist in debugging scripts.
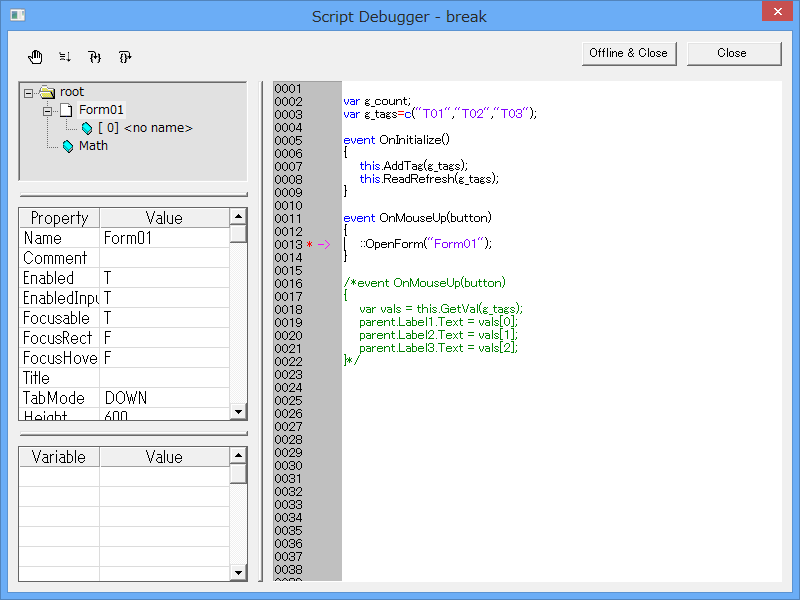
The Script Debugger provides the following features that are particularly useful for debugging:
1.Pause the script during execution and check each line as you execute it (step execution function)
2.Refer to the state of each property of an object
3.Referencing the value of a variable
When debugging with a script debugger, the most common method is to set a "breakpoint" in the script editor in Panel Editor.

You can set a breakpoint anywhere you want to pause script execution. You can set multiple breakpoints at once. When a script is executed in Panel Browser with a breakpoint set, script execution will pause at the breakpoint and the script debugger will automatically appear.
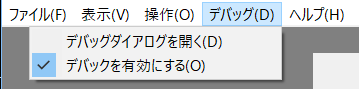
Even if you have not set any breakpoints, you can display the Script Debugger from the Panel Browser menu. You can also set breakpoints from the Script Debugger.
Script Debugger Screen Layout
The script debugger screen configuration and functions are as follows:
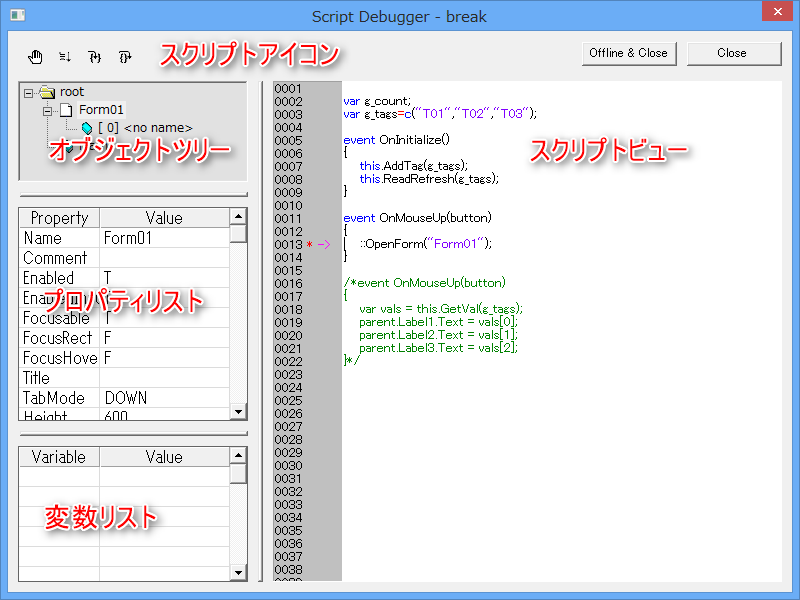
1)Object Tree
The objects currently displayed in Panel Browser, such as forms, dialogs, and controls, are displayed in a hierarchical structure. When you change the object selected from the object tree, the display of the property list and script view also changes. If the object does not have a name, it is displayed as "
2)Property List
You can check the current property values of the object selected in the object tree.
|
In the property list, you can copy (CTRL+C) property names and values. |

3)Variables List
You can check the value of variables during debugging. In the Variable (Variable) column, you can freely write the name of the variable whose value you want to display. Stop the script at a breakpoint and check the value while proceeding through the script line by line.
|
In the variable list, you can copy (CTRL+C), cut (CTRL+X), and paste (CTRL+V) variable names, as well as copy values (CTRL+C). |
4)Script View
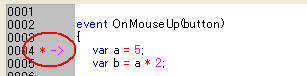
Displays the script for the object selected in the object tree. When a script is paused due to a breakpoint, the currently running script is automatically displayed. "→" is displayed to the left of the line that is being executed.
5)Script Icon
|
Breakpoints |
Sets and clears breakpoints. Normally, breakpoints are set in the script editor of Panel Editor, but you can also set breakpoints from here. Note that the position information of breakpoints set in the script editor is saved in the configuration file, but the information of breakpoints set from the script debugger is not saved in the configuration file. |
|
run |
When you want to stop debugging and continue script execution, click this icon to resume script execution from the line currently being debugged. |
|
Step Into |
It executes the script line by line. If the line to be executed is a user-defined function, it jumps to the script in that function and continues stepping. |
|
Single Line |
Like Step Into, it executes the script one line at a time, but if the line to be executed is a user-defined function, it does not jump to step execution within that function, but instead executes the user-defined function on that line and then proceeds to the next line. |


6)button
|
Ends debugging and closes the Script Debugger. |
|
Turn debugging offline and close the script debugger. Turning debugging offline will temporarily disable all breakpoints. If you want to enable breakpoints again, select "Debug" "Enable Debugging" from the Panel Browser menu.
|
|
Switching between online and offline debugging is useful when debugging events that occur periodically, such as OnTimer events. For example, if you set a breakpoint within a OnTimer event, even if you close the displayed script debugger with the "Close" button, the next OnTimer event will occur immediately and the script debugger will be displayed repeatedly. In such a situation, you can prevent the script debugger from being displayed repeatedly by temporarily switching debugging offline with the "Offline & Close" button. |
Detailed Debugging Procedures
Here, we will explain the specific debugging steps using the following script as an example.
// OnMouseUp event of command Button control
event OnMouseUp(button)
{
	var a = 5;
	var b = a * 2;
	if (sum(a, b) == 10)
	{
		this.Text = "OK";
	}
	else
	{
		this.Text = "NG";
	}
}

function sum(a, b)
{
	return a + b;
}
1.Start Panel Editor, paste Button control into Form01, and write the above script.
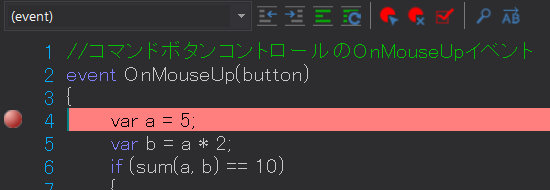
2.Place a breakpoint on the line "var a = 5;".
In the script editor, place the cursor on the line "var a = 5;" and click the breakpoint icon on the toolbar. When a breakpoint is set, a mark will appear to the left of the line number.
3.Run in Panel Browser.
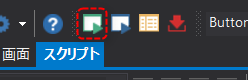
Close the script editor and click the Run icon at the top of Panel Editor to launch Panel Browser.
4.Raises the OnMouseUp event
Click Button control in Panel Browser to generate a OnMouseUp event. When the event occurs, the script debugger will be displayed. The current state is that execution is paused on the line where you set the breakpoint, "var a = 5;". A "→" is displayed to the left of the line to indicate the stop position.
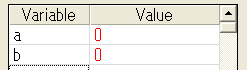
5.Enter "a" and "b" in the variable list (lower left grid).
To check the values of variables a and b, enter "a" and "b" in the Variable column of the variable list.
6.Click the single step icon to execute the line "var a = 5;".
Then, one line of processing will be executed and the "→" will move to the next line. Please confirm that the value of "a" in the variable list has become 5.
7.Click the single step icon again to execute the line "var b = a * 2;". Notice that the "→" moves to the next line and the value of "b" in the variable list becomes 10.
8.Click the single step icon again to execute the line "if (sum(a, b) == 10)".
The "→" will then move to the line "this.Text = "NG";".
This behavior means that the if statement checked whether sum(a, b) was equal to 10.
"The values of a and b are 5 and 10, so the result of sum is not 10. Therefore, the line "this.Text = "OK"" is executed, not "this.Text = "NG""."
I was able to confirm that this works.