|
Plot graph control (PlotGraph)
In Plot graph control you can plot XY data.
You can create scatter plots and line graphs.
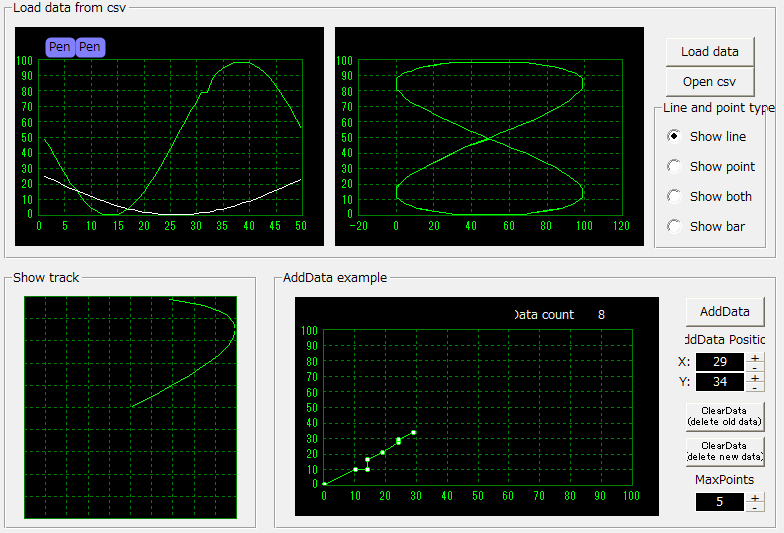
Steps for viewing data
There are four steps to displaying the data:
1) Use the AddPen method to add pens equal to the number of types of data you want to display.
2) Set the X-axis range using the SetXRange method.
3) Use the SelectPen method to set the pen (data) you want to make currently active.
4) Display the data using the AddData method (you can initialize only the data using the ClearData method).
In the sample on the left below, two pens are added in the graph control's own OnInitialize event, and the X-axis range is set to 0 to 50.
Then, when the "Load data" button is pressed, the data is read from the file and displayed using AddData.
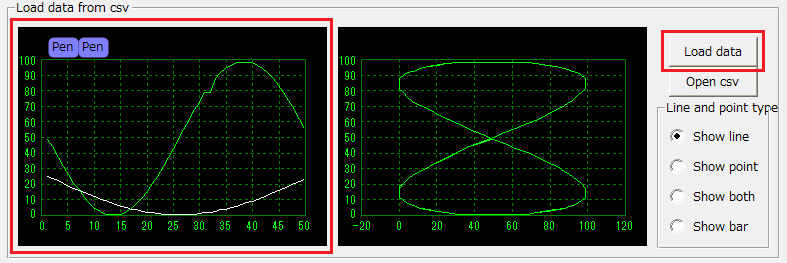
|
// Events for the graph control itself. Adds two pens and sets the X-axis range from 0 to 50.
event OnInitialize()
{
this.AddPen("", "", "default", "analog", "periodic", 0, 100, 0, 100);
this.AddPen("", "", "default", "analog", "periodic", 0, 100, 0, 50);
this.SetXRange(0, 50);
this.SelectPen(1);
}

// "Load Event for the "data" button. The graph data is cleared by ClearData before AddData is executed.
event OnMouseUp(button)
{
var vData;
if (::LoadCsvFile("csvsample.csv", vData) == FALSE)
{
::OpenMessageBox("Can't open file.");
return;
}
parent.Graph1.ClearData();
parent.Graph1.AddData(1, vData[1,0:50], vData[2,0:50]);
parent.Graph1.AddData(2, vData[1,0:50], vData[3,0:50]);
…
}
|
|

|
AddData can add points one by one, or add multiple points at once.
In the above example, the data in the file is added all at once.
For example, in the following example, for pen 1, the first column (counting from 0) of the CSV file is used as the X-axis data, the second column is used as the Y-axis data, and data from row 0 to row 50 is displayed.
If you want to display all rows of data, use AddData(1, vData[1,], vData[2,]).
See Scripts for more information.
parent.Graph1.AddData(1, vData[1,0:50], vData[2,0:50]);
|
|
Set a limit on the number of data
You can set a limit on the number of data points per pen using the pen's MaxPoints property.
If you set a limit, when the number of data added by AddData exceeds the limit, the oldest data will be automatically deleted.
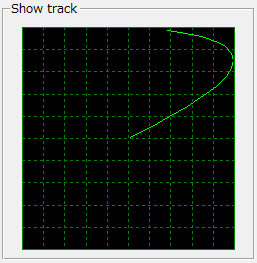
The following sample limits the number of data points to 15.
This is useful, for example, to display the current trajectory of an object moving in XY.
|
// Graph control's own event
event OnInitialize()
{
…
this.SetPenProperty(1, "MaxPoints",15);
this. SetPenProperty (2, " MaxPoints ", 15);
…
}
|
|
|
Data deletion occurs in the following three cases:
1) If the limit set in the MaxPoints property is exceeded, the oldest points will be automatically deleted.
2) When the screen is displayed, data that is outside the screen range is automatically deleted (this setting can be changed using the AutoDeleteMode property).
3) All data will be deleted at once using the ClearData/ClearPen/ClearAll method.
Please note that if you do not delete the data and repeat AddData forever, the number of plot points will continue to increase, and your system may crash due to insufficient memory.
|
|
Representing graphs as lines, points, and bar graphs
|
|
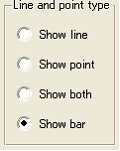
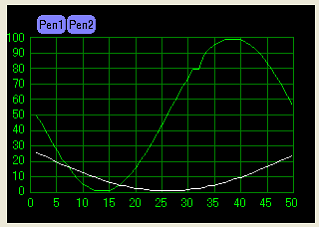
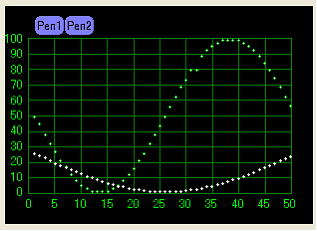
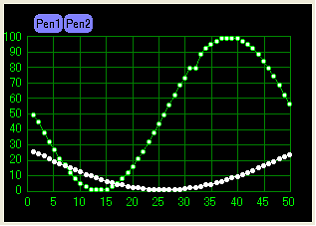
The PlotLineSize/ PlotPointSize properties allow you to set whether the graph is displayed as lines, points, or both points and lines.
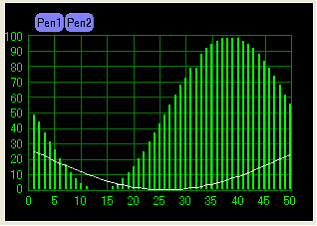
The PlotBarSize property allows you to set the bar graph display of the graph.
Please refer to the Radio button control processing below for a sample of how to set it up.
|
|
|
When displayed with lines only (default). In the example on the left, the line thickness is set to 1 and the point size is set to 0.
PlotLineSize = 1
PlotPointSize = 0
PlotBarSize = 0
|
|
|
|
|
|
When displayed using only dots. In the example on the left, the line thickness is set to 0 and the dot size is set to 2.
PlotLineSize = 0
PlotPointSize = 2
PlotBarSize = 0
|
|
|
|
|
|
When both points and lines are displayed. In the example on the left, the line thickness is set to 1 and the point size is set to 4.
PlotLineSize = 1
PlotPointSize = 4
PlotBarSize = 0
|
|
|
|
|
|
Only pen 1 is displayed in the bar graph.
PlotLineSize = -1
PlotPointSize = -1
PlotBarSize = -1
SetPenPlotSize(1, 0, 0, 0, 0, 2);
SetPenPlotSize(2, 1, 0, 0, 0, 0);
|
|
If you want to change the size of graph points or lines for each pen, set PlotLineSize/ PlotPointSize/ PlotBarSize to -1 and specify the size for each pen using the SetPenPlotSize method.
|
|
When drawing multiple pens in a bar graph, if you want to shift the bars horizontally for each pen so that they do not overlap, set the PlotBarAdjustment property to TRUE.
|
|
Draw horizontal lines such as warning lines on graphs
There are two ways to draw horizontal lines on a graph: "Define a line for the entire group" and "Define a line for each pen."
The lines drawn with the former are called group lines, and the latter are called pen lines.
To draw a group line, use the AddGroupLine method.
The maximum and minimum values of a group line are set to 100 and 0 by default, so if you draw a group line at 50, the line will be drawn exactly in the middle of the graph.
|
AddGroupLine(50); // Add 50 lines (to the currently selected group)
|
|
|
The maximum and minimum values of the group line can be changed with SetGroupLineProperty. For details, see "Getting and Setting Group Information".
|
To draw a pen line, use the AddPenLine method. The pen line is drawn to the maximum and minimum values that you set when you added the pen. The line also moves according to the position of the pen on the screen.
|
AddPenLine(1, 50); // Add 50 lines to pen 1
|
|
|
Getting and setting pen information
You can get and set pen information using GetPenProperty/SetPenProperty.
|
this.SetPenProperty(1, "Title", "Pen01");
|
|
The pen properties are listed below.
Property Name
|
Type
|
explanation
|
Title
|
character
|
The title (displayed center left).
|
Unit
|
character
|
Units (displayed center left with the title)
|
Color
|
Colored letters
|
The color of the graph lines. Specifying "default" will automatically set the optimal color.
|
DataType
|
character
|
Data type. There are 11 types to choose from:
"boolean" - Displayed as bit type data.
"analog" - Display as numeric data.
"enumeration" - A numeric type, but the decimal points are rounded off and displayed as integer data.
"powerfactor00" - Displayed as power factor data (-0 to 1 to +0).
"powerfactor05" - Shown as power factor data (-0.5 to 1 to +0.5).
"powerfactor00p" - Power factor data (-0 to 100 to +0) (% conversion)
"powerfactor05p" - Power factor data (-50 to 100 to +50) (% conversion)
In the case of power factor data, the raw data to be fed into the graph must be as follows. For example, in the case of power factor data (-0 to +0), the raw data should be a value that varies from 0 to 1000. In this case, raw data 0 is a power factor of -0 and 1000 is a power factor of 0. (When it is 500, the power factor is 1.) Then, specify the argument Low (minimum value) as 0 and the argument High (maximum value) as 1000. The raw data will be automatically converted to a power factor and displayed appropriately on the graph.
"powerfactor00r" - Displayed as power factor data (-0 to 1 to +0).
"powerfactor05r" - Displayed as power factor data (-0.5 to 1 to +0.5).
"powerfactor00rp" - Power factor data (-0 to 100 to +0) (% conversion)
"powerfactor05rp" - Power factor data (-50 to 100 to +50) (% conversion)
In the case of power factor data, the raw data fed into the graph must be the power factor value itself, and the Low (minimum value) and High (maximum value) arguments will be ignored.
|
PlotType
|
character
|
Plot type. Choose from "periodic" "changebased" "colorbar". For periodic, the plot points are connected to draw a graph line. For changebased, the graph line is drawn in a stepped pattern. For bits, you should usually choose changebased. For colorbar, a bar is displayed horizontally and filled with a color determined for each value.
|
Low
|
Number
|
The minimum value of the data. Data below the minimum value will not be displayed.
|
High
|
Number
|
The maximum value of the data. Data larger than the maximum value will not be displayed.
|
DisplayLow
|
Number
|
The bottom position of the display range. Specify a value between 0 and 100. The display range indicates where on the graph the top and bottom positions of the Y axis are located, expressed as a percentage. For example, if you set the display range start to 20% and the display range end to 40%, the graph will be drawn within the graph area from 20% to 40% from the bottom of the grid.
|
DisplayHigh
|
Number
|
The top position of the display range. Specify a value from 0 to 100.
|
Visible
|
Boolean
|
Whether to display the pen (graph line). You can temporarily hide the pen by setting this to FALSE.
|
MaxPoints
|
Number
|
Maximum number of plots (number of data) to display. When set to 0, unlimited (default 0). If you exceed the maximum number and perform AddData, the oldest data will be deleted.
|
LineSize
|
Number
|
The thickness of the graph line. When it is 0, the line is not displayed. Default is 1. It is effective when the PlotLineSize property is -1.
|
LineStyle
|
character
|
Line style.
Choose from "SOLID" "DASH" "DOT" "DASHDOT" "DASHDOTDOT". The default is "SOLID".
|
PointSize
|
Number
|
Size of graph points. When this is set to 0, no points are displayed. Default is 0. This is effective when the PlotPointSize property is set to -1.
|
LackLineSize
|
Number
|
The thickness of the graph line to connect missing data. When the value is 0, the line is not displayed. Default is 1. Valid when the PlotLackLineSize property is set to -1.
|
LackPointSize
|
Number
|
Size of missing data points. When this is 0, no points are displayed. Default is 0. Effective when the PlotLackPointSize property is set to -1.
|
BarSize
|
Number
|
Size of the bar graph. When it is 0, the bar is not displayed. Default is 0. It is effective when the PlotBarSize property is -1.
|
ColorBarAlpha
|
Number
|
When colorbar is selected in PlotType, the transparency of the horizontal bar (0 to 1). Default is 0.7. Valid when PlotColorBarAlpha property is -1.
|
ColorBarColor
|
character
|
When colorbar is selected for PlotType, the bar display colors are listed below. From the left, the colors are specified in RGB, separated by commas, as follows: color when the value is 0, color when the value is 1, color when the value is 2, etc.
Example: #00FF00, #FF0000
When the value is 0 (FALSE), it will be drawn in green (#00FF00), and when the value is 1 (TRUE), it will be drawn in red (#FF0000).
Example) #00FF00,#FF0000,#0000FF
When the value is 0, it is drawn in green (#00FF00), when it is 1, it is drawn in red (#FF0000), and when it is 2, it is drawn in blue (#0000FF).
Valid when the PlotColorBarColor property is an empty string.
|
Temp
|
character
|
You can store characters in it. Feel free to use it.
|
|
Getting and setting group information
You can get and set group information using GetGroupProperty/SetGroupProperty.
|
this.SetGroupProperty(1, "GroupTitle", "Group01");
|
|
Below is a list of group properties.
Property Name
|
Type
|
explanation
|
GroupTitle
|
character
|
Group title.
|
StartupXSpan
|
Number
|
The span of the X-axis to be set when switching groups. If there is no need to change the span of the X-axis when switching groups, specify 0. For historical graphs and historical trend graphs, specify the time in seconds for the X-axis span. For example, for one hour, specify 3600 (seconds).
|
Low
|
Number
|
The minimum value for group lines. Default is 0.
|
High
|
Number
|
Maximum number of group lines. Default is 100.
|
Temp
|
character
|
You can store characters. Feel free to use it.
|
|
Getting and setting line information
Lines can be added to each group and to each pen.
To get and set information about lines added to a group, use GetGroupLineProperty/SetGroupLineProperty.
To get and set information about lines added to the pen, use GetPenLineProperty/SetPenLineProperty.
|
this.SetGroupLineProperty(1, "Value", 50);
|
|
Below is a list of line properties.
Property Name
|
Type
|
explanation
|
Value
|
Number
|
Line value. For group lines, the line in the X-axis direction is displayed for the Low/High group property. For pen lines, the line in the X-axis direction is displayed for the Low/High pen property.
|
LineColor
|
Colored letters
|
Line color (e.g. "#00FF00"). If you specify an empty string "", it will be drawn in the default color (white for group properties, pen color for pen lines). The default is the default color.
|
LineStyle
|
character
|
Line style.
Choose from "SOLID" "DASH" "DOT" "DASHDOT" "DASHDOTDOT". The default is "DOT".
|
LineSize
|
Number
|
The line thickness. Default is 1.
|
Text1
|
character
|
The text to display on the right side of the line.
|
Text2
|
character
|
The text to display on the left side of the line.
|
TextColor
|
Colored letters
|
Text color (e.g. "#00FF00"). If you specify an empty string "", it will be drawn in the line color. The default is the line color.
|
TextPosition
|
character
|
Position of the text: "UPPER" - above the line (default). "LOWER" - below the line.
|
Visible
|
Boolean
|
Whether to display the line. You can temporarily hide the line by setting this to FALSE.
|
|
|