overview
This article describes how to use the Historical data server (CSV) action to display a CSV file in a trend graph.
Download the sample
The creation examples shown on this page are provided with samples.
The sample can be downloaded from below.
Setup Procedure
■ Historical data serverAction settings
1.Add Historical data server (CSV) action
Open the target project and have the server configuration file open in FA-Server.
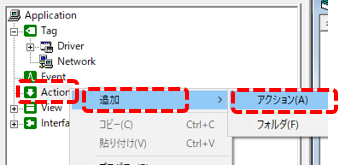
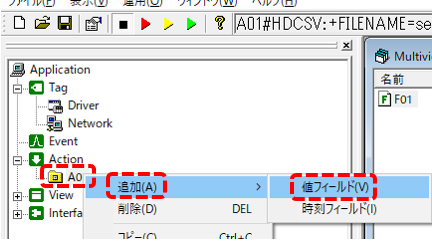
Right-click Action in the left tree of FA-Server to display the menu, then select "Add" and "Action".
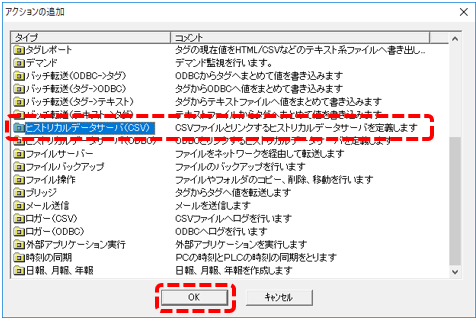
The Add Action dialog will appear, so select "Historical data server (CSV)" and click the OK button.
A new action has been added under Actions in the tree as "A01".
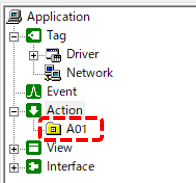
You can change this name if you want, but for this example we'll leave it as is.
2.Configuring Historical data server (CSV) actions
In the Historical data server configuration, you need to set the folder where the CSV files are stored and the file name rules.
This section explains a setting example assuming that the following CSV file is stored.
(Project folder) \server_data\import\LOG20180910.csv
The file name is composed of three alphabetical characters "LOG", followed by eight digits for the date (yyyymmdd), and the extension is "csv". In other words, there is one file per day for the log data.
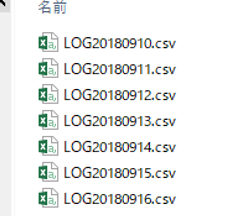
Also, if you look inside the import folder using Explorer or similar, you will see that seven days' worth of log files are stored, as shown below.
If you open one of the above files using Notepad or similar, you will see log data in the following format.
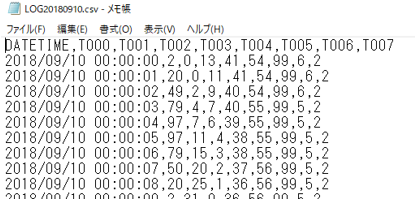
•The first line is the header line
•The first column is a date/time field
•Eight data fields from the second column onwards
Taking the above into consideration, open the properties of the Historical data server (CSV) action registered above and configure it.
|
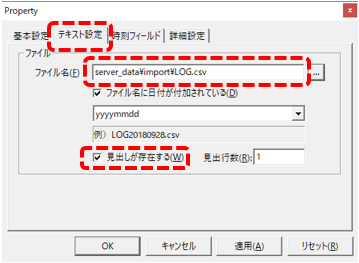
Shown on the left is the "Text Settings" tab for the action.
In the file name, specify the folder and file name for the log data to be output. Here, specify as follows:
server_data\import\LOG.csv
Check the box for "Date is added to the file name." You can leave the yyyymmdd part as the default.
Check that the heading exists.
|
As you change the settings on the screen above, an example of the actual filename will be displayed in the center of the screen - please check that it matches the specifications for the filename you want.
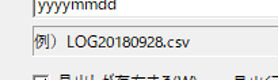
Please check that the above format is correct and close the settings by clicking the "OK" button.
3.Define the fields of Historical data server (CSV)
Next, define the fields for the Historical data server action.
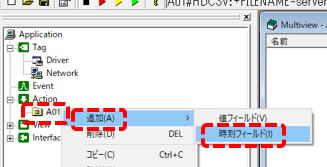
Right-click on "A01" in the tree on the left and select "Add" and "Time Field".
In the multiview, you can see that a field called "F01" has been added to A01.
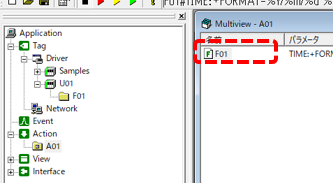
Open the properties of the F01 field.
|
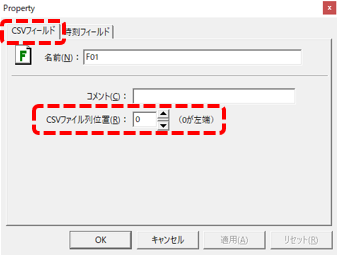
On the CSV Fields tab, specify the name of the field and its column position in the CSV file.
You can change the name, but in this example we will leave it as F01.
When setting the column position, edit the numbers to match the actual CSV format (the first number is a sequential number starting with 0). In the CSV file we are importing this time, the first column is the date and time, so leave it as "0".
|
|
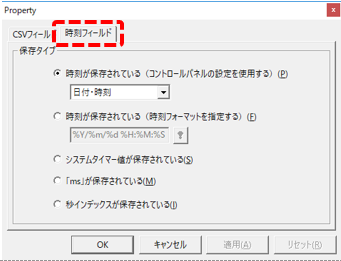
The Time Field tab allows you to further define the date-time format for this field.
Leave the default settings and click the "OK" button to close.
|
Next, define the value field. You need to add one value field for each data column you want to import. Add them one by one according to the format of the CSV file.
To add a value field, right-click "A01" in the tree on the left and select "Add" and "Value Field".
Then, a field called "F02" was added to A01.
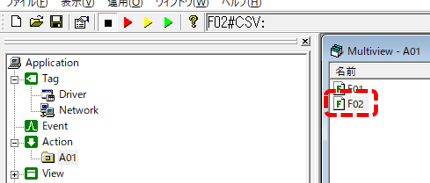
Open the properties of the F02 field and set it.
|
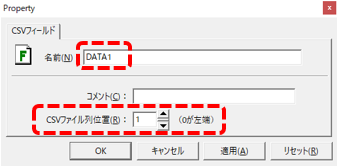
On the CSV Fields tab, specify the name of the field and its column position in the CSV file.
The name specified here will be the data source name that will be displayed when you select a pen on the trend graph. For example, change the name to "DATA1".
Also, set the column position of the target field in the CSV file. Edit the numbers to match the actual CSV format (note that the numbers start with 0 and are consecutive).
|
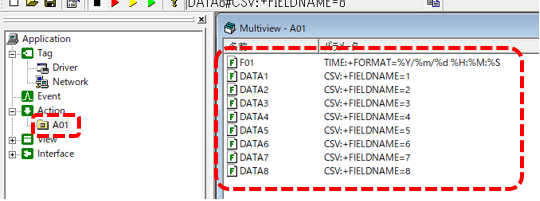
Follow the same steps as above to add one value field for each data column in your CSV file.
If you display the contents of the A01 action in multiview, you can check the registered contents of the fields.
This completes the setup.
Operation check
Now let's check how it works.
Click on Online (yellow arrow) at the top of the FA-Server screen.
![]()
After starting FA-Server, run FA-Client to display the trend graph screen.
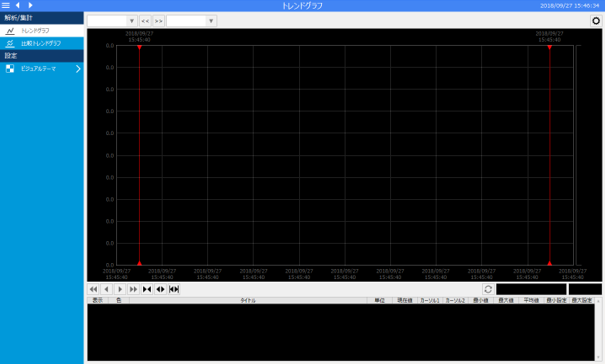
Currently, no pens are registered, so nothing is displayed on the graph.
Display the pen selection from the setting menu of the trend graph screen and add a pen.
Below is an example of setting up a pen group.
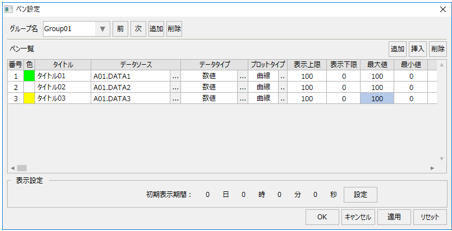
|
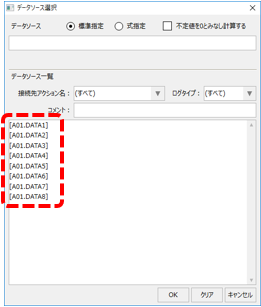
When you display the data source selection dialog from the pen settings, the name of the value field you defined in the Historical data server (CSV) action earlier is displayed.
|
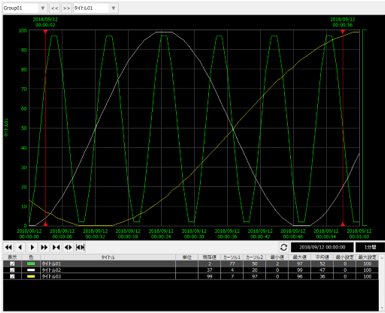
After adding the pen, uncheck Real-time update of the trend graph and specify the date and time when the CSV file data exists as the start date and time of the graph.
Verify that the log data from the CSV file is displayed on the trend graph.