overview
This article describes the procedure for displaying log data from a database in a trend graph using the Historical data server (ODBC) action.
Download the sample
The creation examples shown on this page are provided with samples.
The sample can be downloaded from below.
The above sample includes table creation DDL (logtable.sql) for each DBMS. The sample DDL is stored in the following folder.
(Sample folder) \table_DDL
\myslq\logtable.sql
\oracle\logtable.sql
\postgresql\logtable.sql
\sqlserver\logtable.sql
The procedure introduced here describes the construction procedure using the following environment.
OS: Windows10
DBMS: SQL Server 2017
|
The latest information on supported database types, versions, etc. can also be found in the FAQ on our website, "What database products are supported?". |
Setup Procedure
■Preparing the database
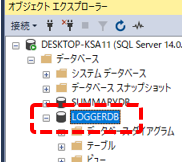
First, prepare a database to connect to and reference from the Historical data server (ODBC) action. You can name the database freely, but for this example, we will assume that a database named "LOGGERDB" has been created.
Below is an example displayed in the Object Explorer of SQLServer Management Studio.
■About the table for referencing log data
Next, prepare a table in the above database in which log data will be stored.
You can name the table freely, but as an example, we will assume that a table named "LOGTABLE" has been created in the LOGGERDB database.
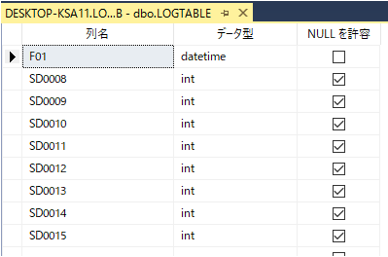
Please create the following fields in the LOGTABLE table. You can also create the table using the table creation DDL (logtable.sql) included in the sample (*The following is an example for SQL Server).
Note that the data types below are just examples. Be sure to select the appropriate data type depending on the type of data being stored.
Field Name |
Data Types |
Key Settings |
NULL Tolerance |
supplement |
F01 |
datetime |
(none) |
do not |
The date and time the record was created. |
SD0008 |
int |
(none) |
do |
Prepare a numeric type field to store numeric tags. |
SD0009 |
int |
(none) |
do |
Ibid. |
SD0010 |
int |
(none) |
do |
Ibid. |
SD0011 |
int |
(none) |
do |
Ibid. |
SD0012 |
int |
(none) |
do |
Ibid. |
SD0013 |
int |
(none) |
do |
Ibid. |
SD0014 |
int |
(none) |
do |
Ibid. |
SD0015 |
int |
(none) |
do |
Ibid. |
Below is an example displayed on SQLServer.
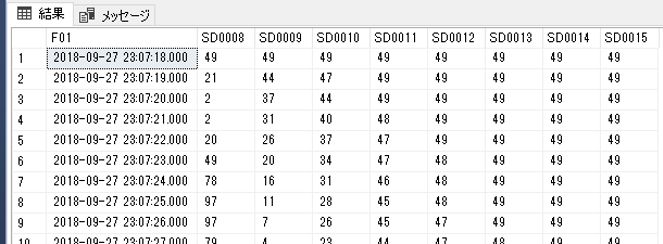
Once you have created the table, register some log data for testing purposes.
Below is an example of registering data at one-second intervals using SQLServer Management Studio.
(Example of display using SQLServer Management Studio)
|
This sample includes table creation DDL (logtable.sql) for DBMS other than SQLServer. Please use it as a reference when defining tables in the DBMS you actually use. |
|
The names of data types of fields defined in the table on the database side (for example, "INT", "INTEGER", "NUMBER", "FLOAT", "DOUBLE", etc.) vary depending on the type of DBMS. For actions that require you to manually create a table in advance, such as Alarm server (ODBC), you must define the table appropriately on the connected DBMS side. For recommended data types for each connectable DBMS, see "Setting up a connection to the database" in the Appendix. |
|
When connecting to a database that uses PostgreSQL, the table names and field names in the tables prepared in the database must all be defined in lowercase. |
■ Historical data serverAction settings
1.Add Historical data server (ODBC) action
Open the target project and have the server configuration file open in FA-Server.
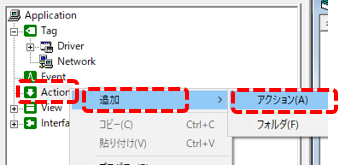
Right-click Action in the left tree of FA-Server to display the menu, then select "Add" and "Action".
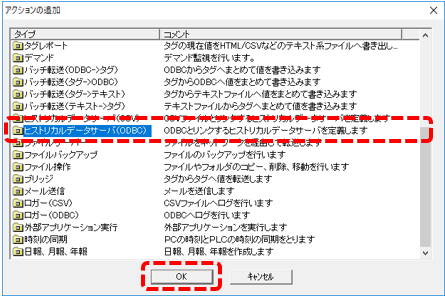
The Add Action dialog will appear, so select "Historical data server (ODBC)" and click the OK button.
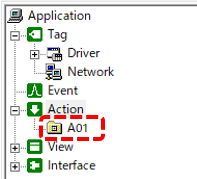
A new action has been added under Actions in the tree as "A01".
You can change this name if you want, but for this example we'll leave it as is.
2.Configuring Historical data server (ODBC) actions
Next, open the properties of the Historical data server (ODBC) action registered above and configure it.
|
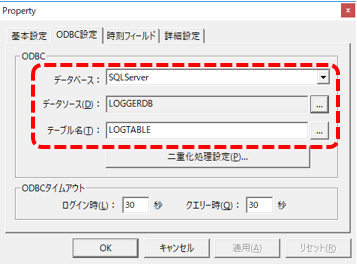
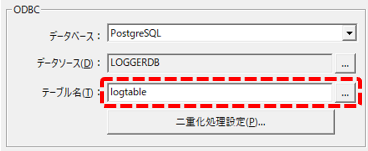
On the left is the "ODBC Settings" tab.
From the database selection, select the DBMS to connect to. In this example, select "SQLServer".
For the data source, set the ODBC data source to connect to the database "LOGGERDB" that you prepared in advance. The data source setting procedure can be done by common operations for each DBMS. For ODBC settings, please refer to the description in "ODBC Settings" in the common settings for actions.
For the table name, specify the table you want to reference. Here, it is "LOGTABLE".
|
|
When connecting to a database using PostgreSQL, the table names and field names in the tables prepared on the database side must all be defined in lower case. Therefore, make sure to specify the table names below in lower case.
(Example for PostgreSQL)
|
3.Define the Historical data server (ODBC) fields
Next, define the fields for the Historical data server action.
Right-click on "A01" in the tree on the left and select "Add" and "Time Field".
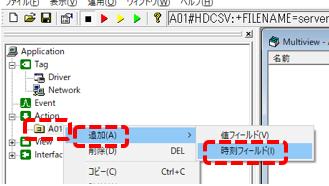
In the multiview, you can see that a field called "F01" has been added to A01.
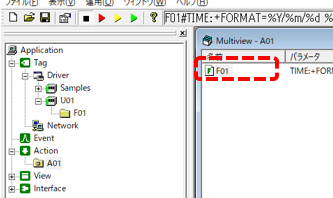
Open the properties of the F01 field.
|
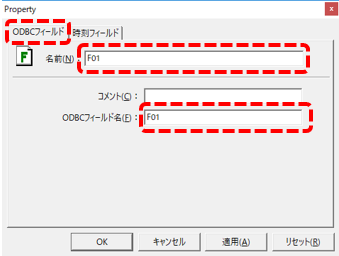
On the ODBC Fields tab, set the following:
For the name, specify the name of the field for this action. Here, we will use "F01".
For the ODBC field name, specify the field name of the table on the database. Specify "F01", which is the field name of the table you prepared in advance.
|
|
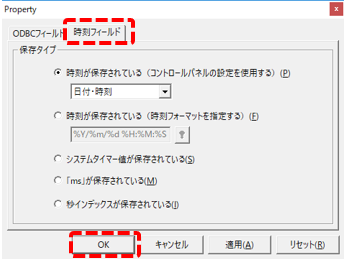
The Time Field tab allows you to further define the date-time format for this field.
Leave the default settings and click the "OK" button to close.
|
Next, define the value field. You need to add one value field for each column of data you want to import. Add them one by one according to the format of the table in the database.
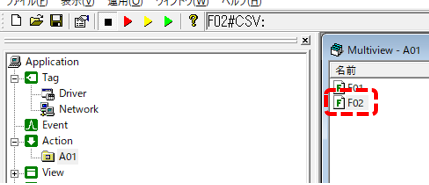
To add a value field, right-click "A01" in the tree on the left and select "Add" and "Value Field".
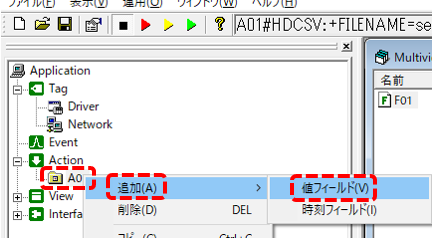
Then, a field called "F02" was added to A01.
Open the properties of the F02 field and set it.
|
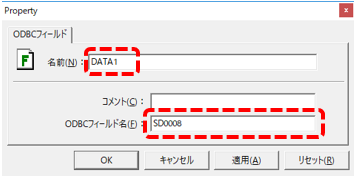
On the ODBC Fields tab, set the following:
For the name, specify the field name on the action side. Here, we will use "DATA1".
For the ODBC field name, specify the field name of the table on the database. In this example, specify "SD0008", which is the field name of the table you prepared in advance.
|
Follow the same procedure as above to add all value fields that correspond to each field in the database, one by one.
When you display the contents of the A01 action in multiview, you can see that the following fields are registered:
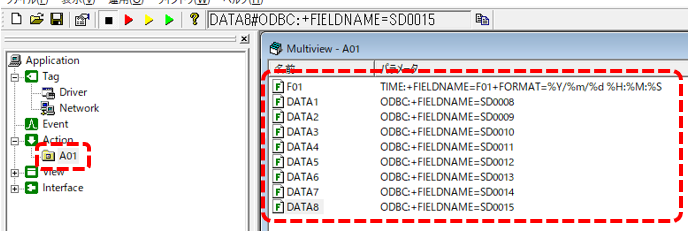
This completes the setup.
Operation check
Now let's check how it works.
Click on Online (yellow arrow) at the top of the FA-Server screen.
![]()
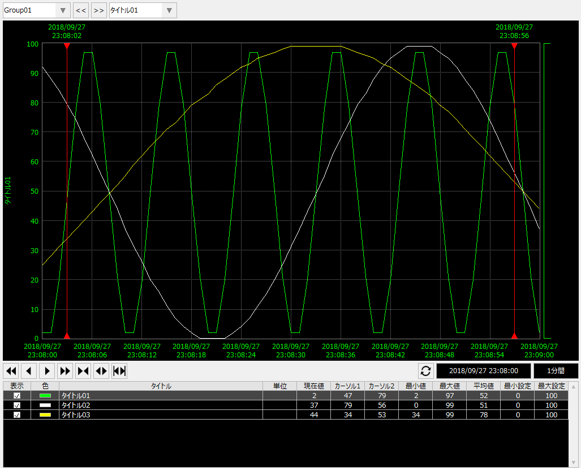
After launching FA-Server, run FA-Client to display the trend graph screen.
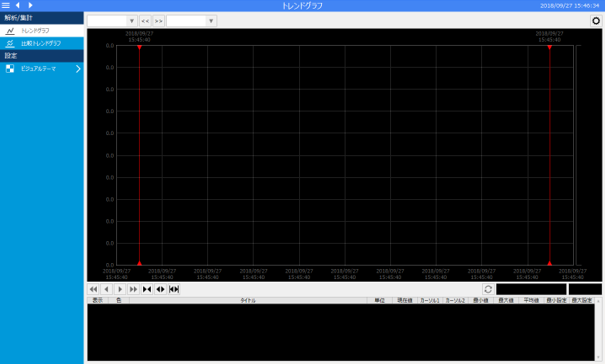
Currently, no pens are registered, so nothing is displayed on the graph.
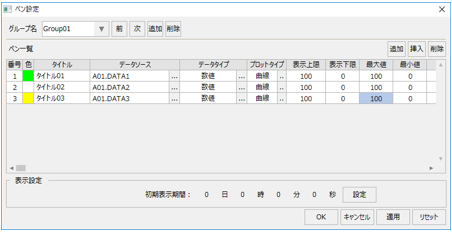
Display the pen selection from the setting menu of the trend graph screen and add a pen.
Below is an example of setting up a pen group.
|
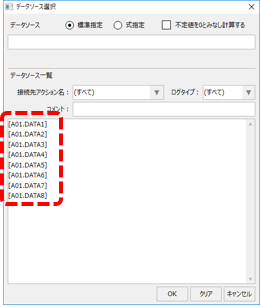
When you display the data source selection dialog from the pen settings, the name of the value field you defined in the Historical data server (ODBC) action earlier is displayed.
|
After adding the pen, uncheck the real-time update of the trend graph and specify the date and time when data exists in the table on the database as the start date and time of the graph.
Verify that the log data stored in the database table is displayed on the trend graph.