Trend graph and logging functions
The trend graph is a function for displaying the transition of time-series log data saved in a CSV file or database as a graph.
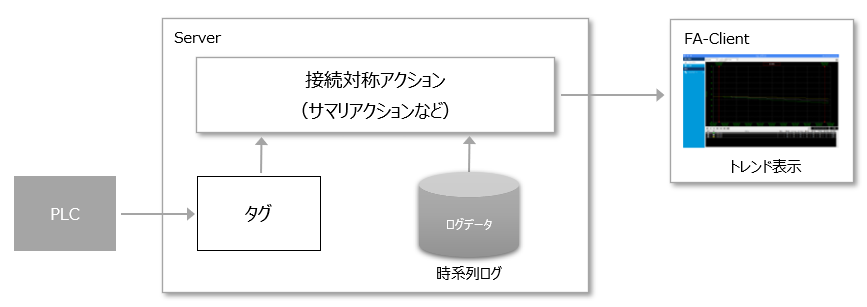
The trend graph screen uses the trend graph screen of FA-Client. The trend graph screen connects to the connected action (summary action, etc.) registered in FA-Server to obtain the log data for the display period, and displays it as a graph on the screen.
The basic concepts of trend graphs and logging functions are explained below.
content |
overview |
Logger actions and summary actions
|
We will introduce the two main logging features of FA-Server, logger actions and summary actions, and explain the differences between them. |
About the trend graph screen (FA-Client)
|
A brief explanation of the trend graph screen of FA-Client. |
Relationship between trend graph and server function
|
This section describes the server functions that can be connected from the trend graph. |
|
|
This section describes the data formats that can be displayed as trend graphs. |
|
For more information about summary actions, see "Summary Actions". |