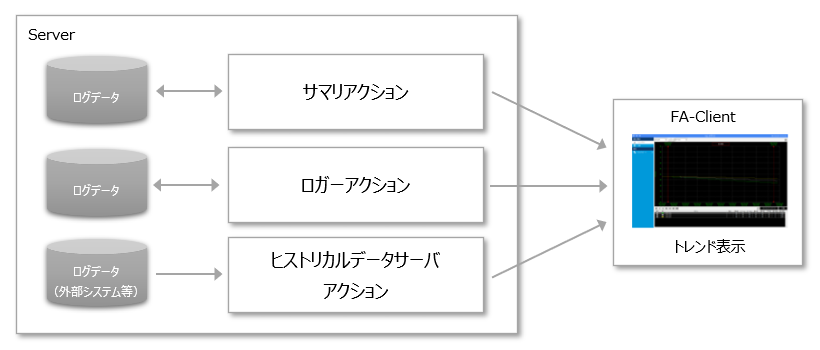
Relationship between trend graph and server functions
The trend graph retrieves log data by connecting to the FA-Server action and displays it in a graph on the screen.
The actions that can be connected from the trend graph are as follows:
Action Name |
Commentary |
This is a logging-only action. It logs tag values in chronological order as historical data.
|
|
This is an action for logging and aggregation that integrates logging, aggregation, and reporting functions. Tag values can be logged in chronological order as historical data, and aggregated data can be automatically generated in any unit, such as by hour, day, or month.
|
|
This action allows you to link table data in CSV files or ODBC databases. You can map historical data created by external systems.
|
Each of the above actions is available in two types: CSV and ODBC, and trend graphs can be connected to either type.
For information on the types of DBMS that can be connected, please refer to "About supported databases".
In addition, with the trend graph function, even in an environment where the actions in the above table are running in parallel, you can connect to multiple actions at the same time and display them on the same graph. Also, even if the logging cycles of each historical data are different (for example, if 1 second logs and 5 second logs are mixed), they can be displayed on the same graph.