Trend graph screen operations
This section explains the basic screen operations for trend graphs.
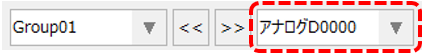
■ Group selection operation
You can select a group from the following combo box displayed at the top of the screen.
You can move to the group before or after the selected group by clicking the "<<" and ">>" buttons. Selecting a group will display the pens registered in that group.

■ Pen selection operation
You can select a pen from the combo box shown above at the top of the screen.
When you switch the selected pen, the pen name displayed on the left side of the graph will change and the display color will change to that of the pen.
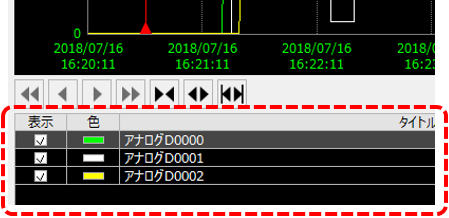
You can also switch pen selection by clicking on the row of the desired pen in the pen grid displayed at the bottom of the screen.
|
You can also show or hide the pens by clicking the check mark in the pen grid.
|
■ Show/hide the settings menu
|
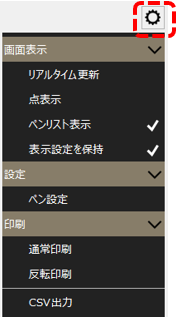
Click the settings icon (gear) displayed in the upper right corner of the trend graph screen to show/hide the settings menu.
You can use this menu to switch graph update modes, call up pen settings, print graphs, and output CSV data.
|
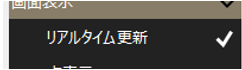
■ Switch between real-time and history display
By clicking "Real-time update" from the settings menu, you can switch between real-time display and history display.
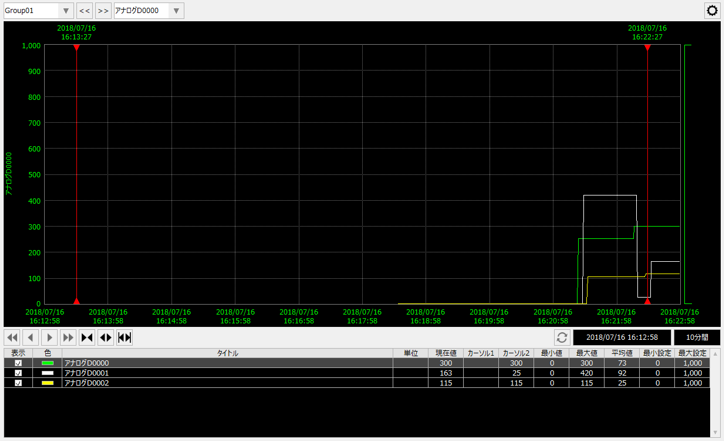
■ Probe operation
There are two red vertical lines displayed on the graph. These lines are called "probes" or "cursors."
The top of the probe displays the date and time of your current location.
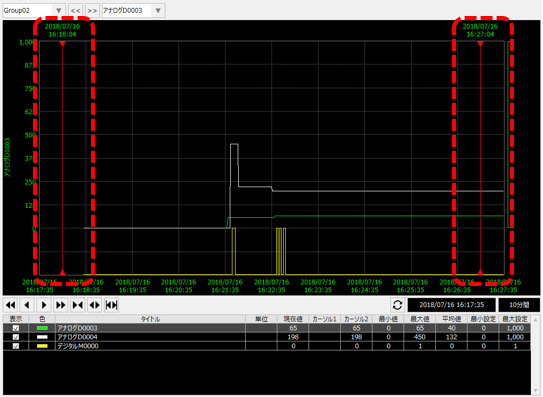
You can move the probe freely left and right by dragging it with the mouse.
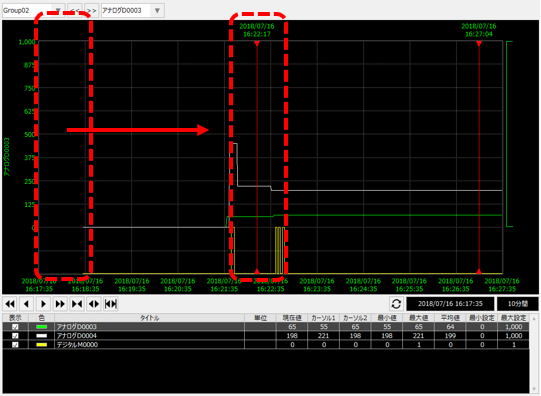
When you operate the probe, the pen grid display at the bottom of the screen changes dynamically. You can check the current probe position value (Cursor 1, Cursor 2), maximum, minimum, average value between the probes, etc.

You can also save historical data between probes to a CSV file by selecting "CSV Output" from the settings menu.
![]()
■ Enlargement and reduction
You can zoom in and out on the graph by clicking the icons at the bottom of the graph.
|
Reduce the display range. |
|
Expand the display range. |
|
The period between the probes is enlarged as 100%. |
In addition to the above, when in history display mode, you can select a range in the graph area with the mouse to enlarge the range.
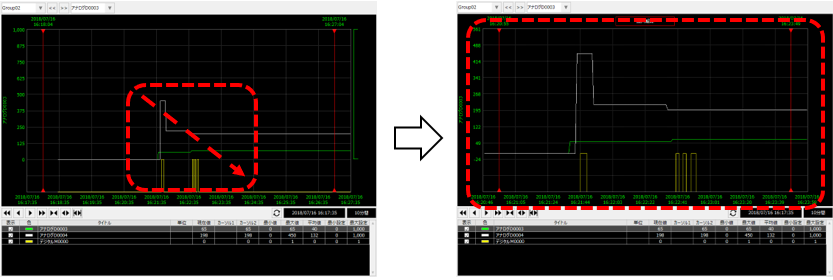
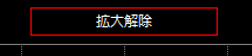
When you zoom in by selecting a range with the mouse, the following button will be displayed at the top of the graph. Clicking this button will return the graph to its original view.
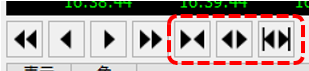
■ Scroll
In history display mode, the following icons at the bottom of the graph become operable.
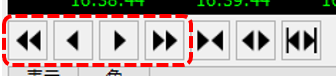
|
Scrolls the graph display backward by page. |
|
Scrolls the graph display backwards by half a page. |
|
Scrolls the graph display forward by half a page. |
|
Scrolls the graph display forward one page at a time. |
■ Display period and start date and time operations
You can change the display period (display span) and perform other operations from the following area at the bottom of the graph.
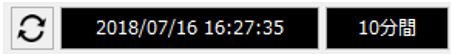
|
The start position of the graph (the right edge of the graph) is updated to the current time. |
||
|
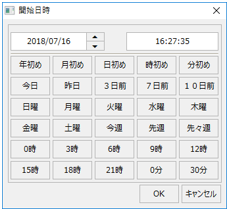
Displays the start date and time of the current graph. Clicking this displays the start date and time selection dialog.
|
||
|
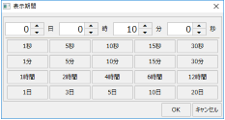
The graph display period is displayed. Clicking this will display the display period selection dialog.
|
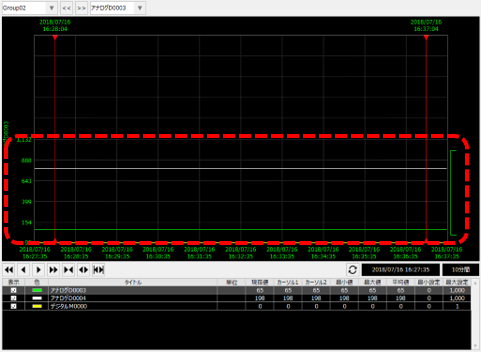
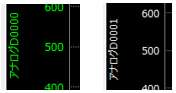
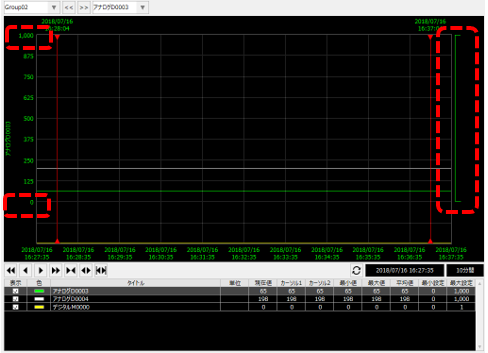
■ Changing the range
The range of the vertical axis of the trend graph can be freely changed for each pen.
|
For example, in the case of the pen currently displayed on the left, the display range from the lower limit to the upper limit of the graph is from 20% to 100%, and the values displayed are from 0 to 1000.
This display range can be edited by manipulating the range display shown to the right of the graph (this part resembles an inverted "C" character in katakana).
|
|
For example, try dragging the bottom of the range display with the mouse and shifting it upwards.
|
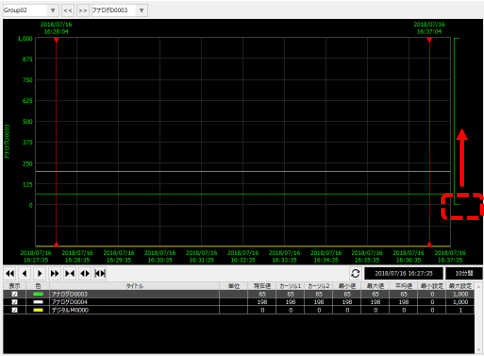
|
Then, the range display of the currently selected pen will change as shown on the left.
|
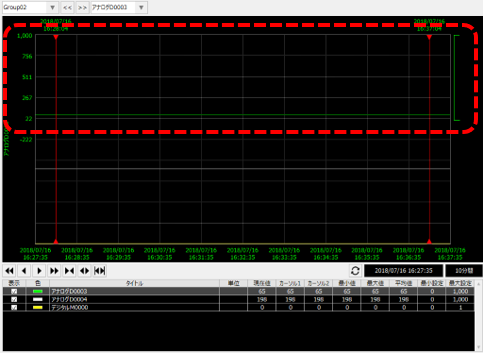
|
The range display can be moved with the mouse.
For example, try dragging the range display area shown on the left downward with the mouse.
|
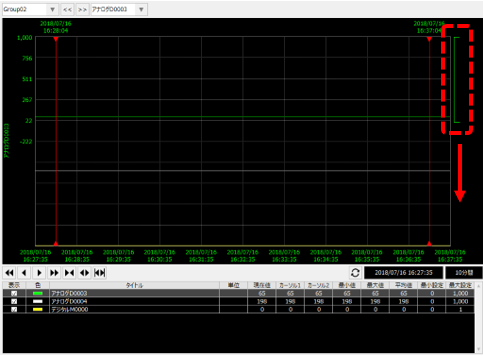
|
Then, the range display of the currently selected pen moves down, and the displayed graph also moves.
The initial range setting can be specified when setting up the pen.
|