overview
Pen settings for trend graphs are usually done from the pen settings screen while the client is running.
The following explains the details of the pen setting operation of the trend graph. Note that the following operation should be performed while both FA-Server and FA-Client are running online.
•Displaying the pen settings dialog
•Adding and editing pen groups
•Trend graph initial display period
•Pen title, maximum, minimum, units, decimal places
•Pen display upper and lower limits
•Pen data type, plot type, size
•About the plot types "Color bar" and "Bar"
Display the pen settings dialog
Pen settings are made from the Pen Settings dialog, which can be called up from the menu on the trend graph screen.
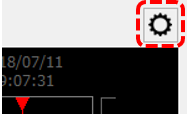
To display the menu, click the settings icon (gear icon) in the top right corner of the screen.
Select "Pen Settings" from the menu displayed on the right side of the screen.
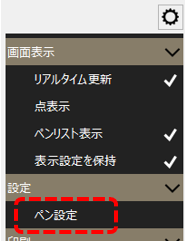
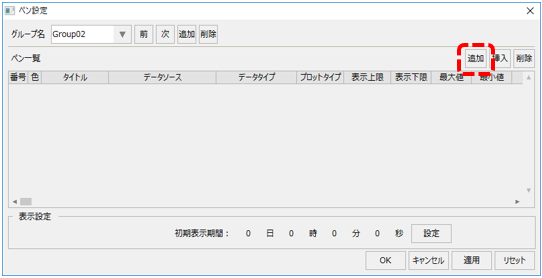
The pen settings dialog box appears.
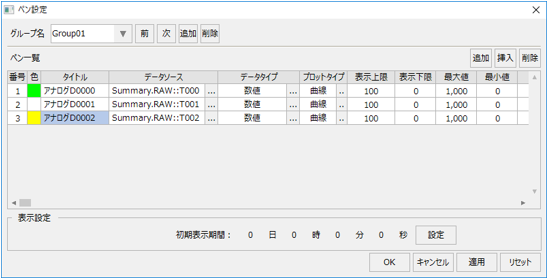
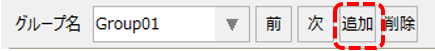
To add a pen group, click the Add button to the right of the group name.
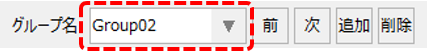
The name "Group02" was automatically assigned to the new group, and it was added. If you want to change the automatically assigned group name, you can edit it directly in the combo box.
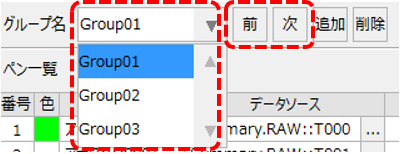
If you want to switch the group for which you want to set pen settings, you can select the desired group from the combo box, or use the "Previous" and "Next" buttons to switch the currently selected group.
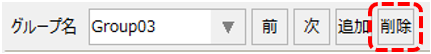
Here, you can delete the currently selected group by clicking the "Delete" button.
Below are some specific examples of pen editing operations.
Pens can be edited in groups.
|
There are currently no pens registered in the group listed above.
To add a pen, click the "Add" button in the top right corner of the pen list.
|
|
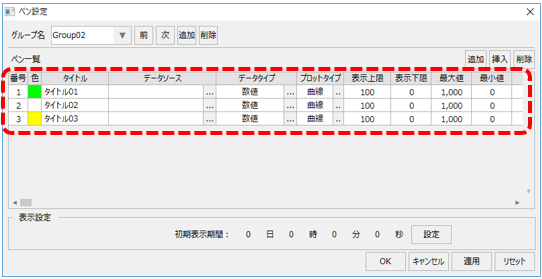
The image on the left shows the state when a pen has been added.
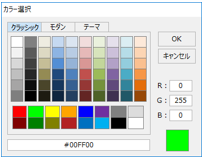
When you add a pen, a recommended color is automatically assigned to the pen's display color. If you want to change the display color, you can double-click the "Color" frame in the pen list to display the color selection dialog and change the color.
(Color selection)
|
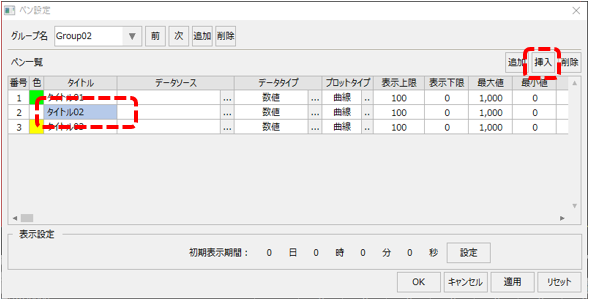
If you select a row in the pen list and click "Insert", you can insert a pen at any position.
|
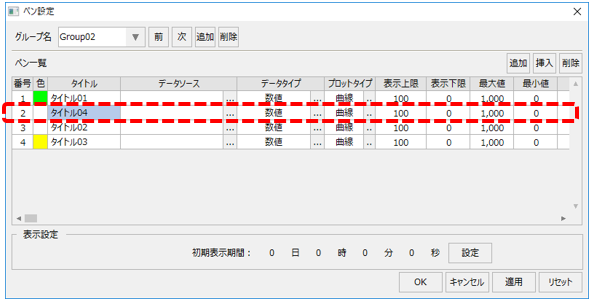
As an example, select the second row and click the "Insert" button.
|
|
Then, a new pen was inserted between the first and second lines.
|
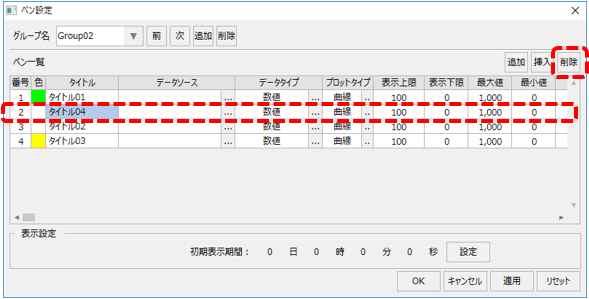
To delete a pen, select the desired line and click the Delete button.
|
As an example, select the second row (Title 04) added above and click the "Delete" button.
|
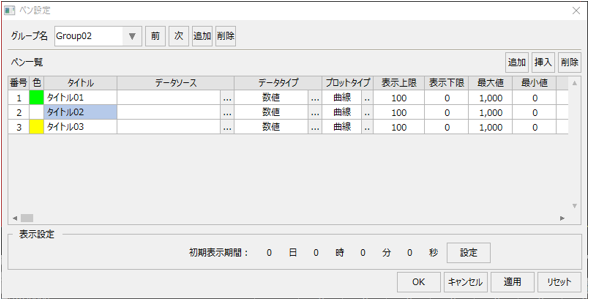
The pen has been deleted.
|
|
Trend graph initial display period
The pen settings dialog has an "Initial display period" setting.
|
This setting can be set for each group. This setting will be the initial value for the graph display period when the target group is selected on the trend graph screen.
If no setting is made, the display period of the last displayed group will be used. If no initial setting has been made for any group, it will automatically be set to 1 minute.
|
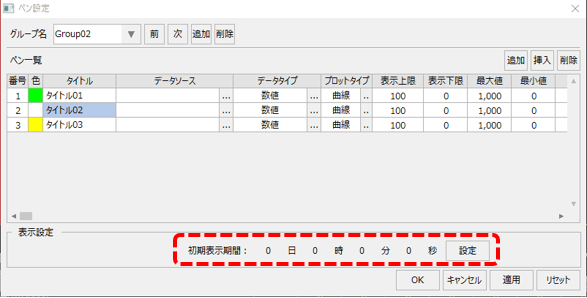
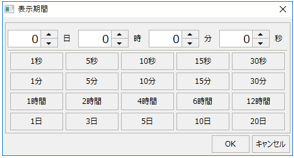
To set the initial display period, click the "Settings" button below.
![]()
This will display the display period selection dialog.
You can set any period in days, hours, minutes, and seconds.
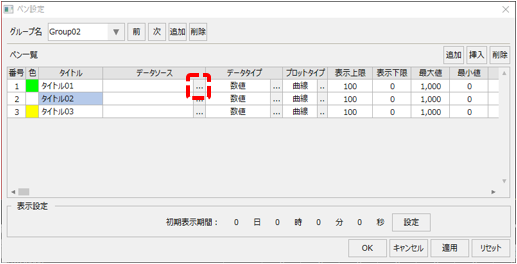
Once you've added a pen, assign it a data source.
|
The image on the left shows that no data source has been selected.
To assign a data source, click the Select button to the right of the Data Source column in the pen list.
|
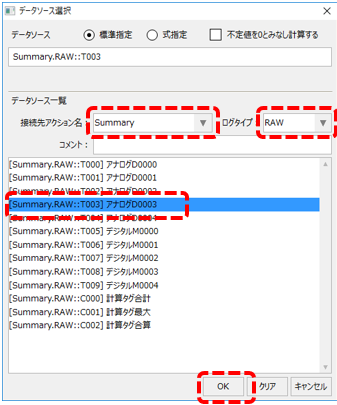
This will display the data source selection dialog.
|
The destination action name combo box displays actions that can be connected from the trend graph. The example on the left is when "Summary" is selected.
The Log Type combo box allows you to narrow the list by selecting the type of log data that can be displayed. The left image is an example of selecting "RAW". Note that RAW means raw data, and refers to raw logging data, not aggregated data such as daily reports.
The list will show data sources that meet the conditions selected above. To select a data source, select the desired row from the list and click the OK button.
|
|
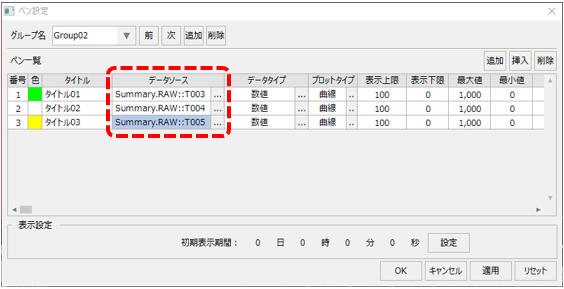
The example on the left shows a data source assigned to each pen.
Once a data source is selected, its name will be displayed in the Data Source field.
|
Pen title, maximum, minimum, units, decimal places
You can freely change the title of the pen.
|
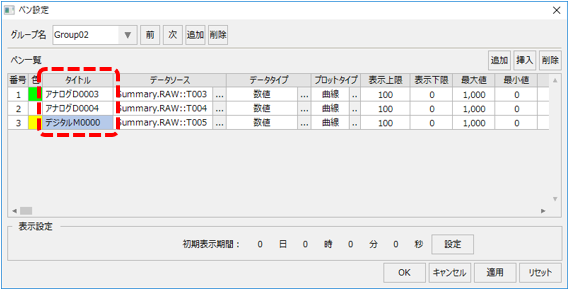
You can directly edit the title of a pen by double-clicking the title field in the pen list.
The example on the left shows the titles of each pen changed to "Analog D0003", "Analog D0004", and "Digital M0000".
|
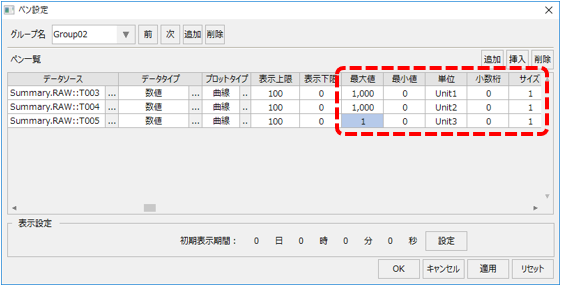
You can also specify maximum and minimum values, units, decimal places, and size for the pen.
Settings for units, decimal places, size, etc. can be displayed by scrolling the pen list to the right.
|
For the maximum and minimum values, specify the maximum and minimum values to be displayed on the graph. For example, if you want to display values from 0 to 100, set the maximum value to 100 and the minimum value to 0. Also, if you want to log bit tags and display them on the graph, set the maximum value to "1" and the minimum value to "0".
You can specify any character string for the unit, such as "℃", "V", "A", etc. The unit specified here will be displayed in the title section of the trend graph screen and in the pen grid at the bottom of the screen.
You can specify the number of decimal points for each pen. The data displayed on the graph will be formatted with the decimal points specified here. You can also specify the thickness of each pen by setting the size. Normally, this is set to "1", and the larger the number, the thicker the pen will be.
|
Pen display upper and lower limits
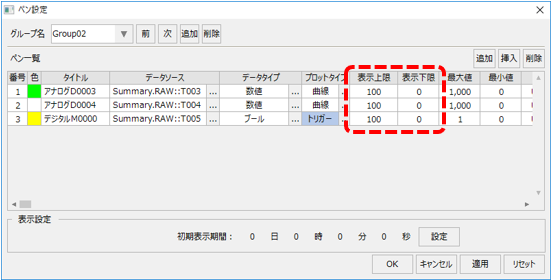
In the pen display upper and lower limit settings, you can specify the lower and upper limits of the target pen's display area in percentages relative to the vertical width of the graph display area. By default, the lower limit is 0 and the upper limit is 100, so the graph will be displayed using the full vertical width of the graph.
|
The default setting is an upper limit of 100 and a lower limit of 0, as shown on the left.
|
|
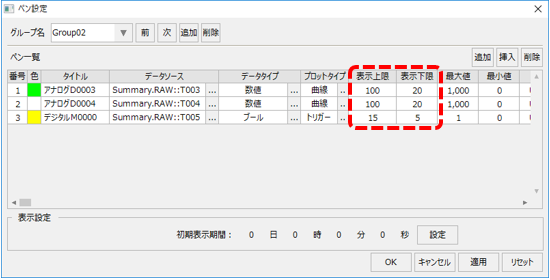
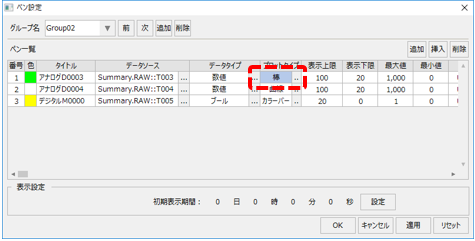
The example on the left is a setting.
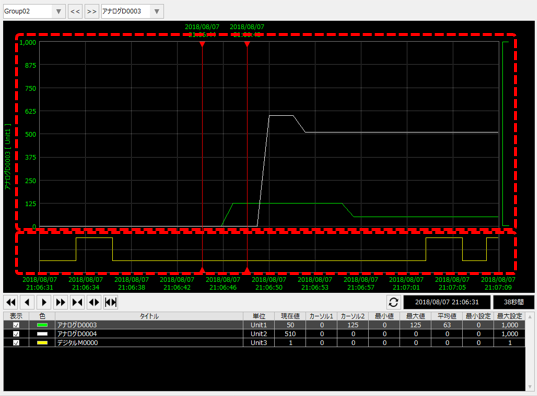
In this example, the two analog pens have an upper limit of 100 and a lower limit of 20, and the one digital (bit) pen has an upper limit of 15 and a lower limit of 5. By setting it in this way, you can use the upper part of the graph display area to display numerical values, and the lower part to display bit triggers.
|
Here is an example of the actual display above. The upper 80% of the graph area shows analog values, and the lower 20% shows digital triggers.
Pen data type, plot type, and size
You can specify the data type and plot type for the pen settings. By combining these appropriately, you can display a graph that suits your purpose.
First, let's talk about data types.
|
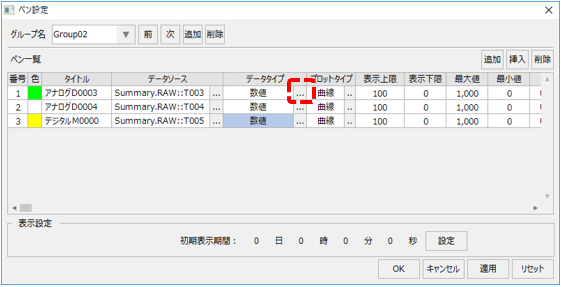
To set the data type, click the Select from Pen List button.
|
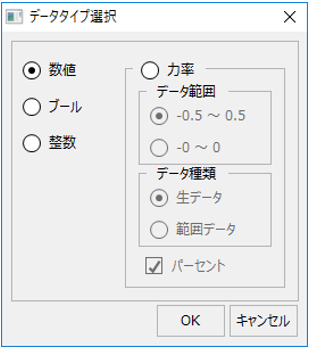
Then the following selection dialog will be displayed:
|
Data types include "Numeric", "Boolean", "Integer" and "Power Factor".
•Select "Number" to display numbers with decimal points. •If you want to display bits (0/1), select "Boolean". •If you want numbers to appear as whole numbers, select "Integer." •To display the power factor, select "Power factor." For information on displaying the power factor, see "Displaying the power factor on the trend graph."
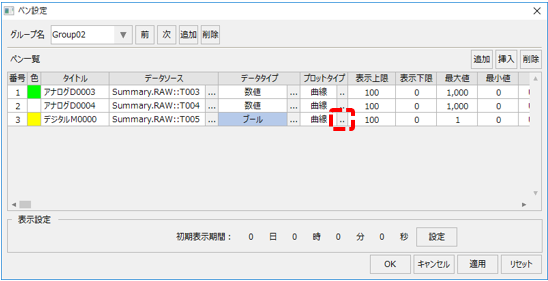
If you want to display bit tag log data, select "Boolean."
|
Next, we will explain how to set the plot type.
|
To set the plot type, click the Select from Pen List button.
|
Then the following selection dialog will be displayed:
|
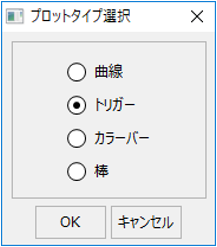
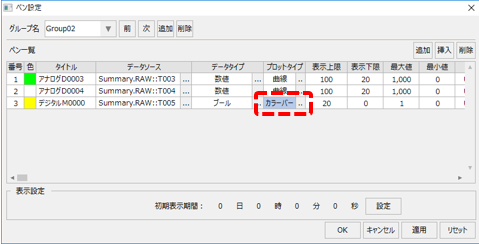
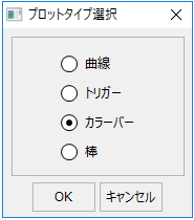
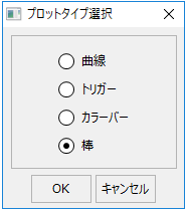
Plot types include "Curve", "Trigger", "Colorbar" and "Bar".
•Selecting "Curve" will display the data as a broken line, which is commonly seen in trend graphs. •"Trigger" is suitable for displaying bits (0/1). The rising and falling edges of the value are displayed as pulses. •"Color bars" are another good way to display bits, using colored fills to indicate the rising and falling edges of the value. •Select "Bar" to display the values as a bar graph.
|
About plot types "Color bar" and "Bar"
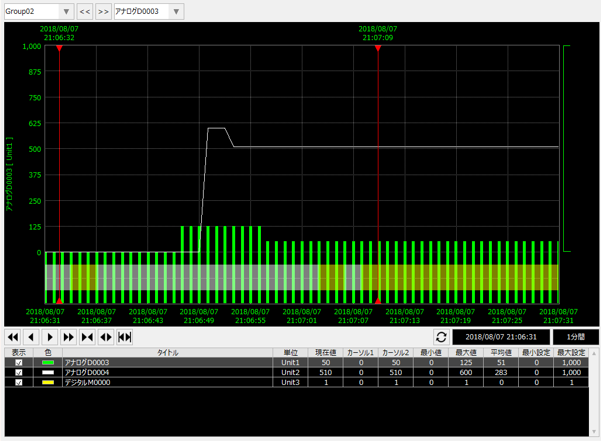
We will explain the differences in display depending on the plot type using examples.
In the example below, the values of two analog tags, U01.F01.D0003 and D0004, and one bit tag, M0000, are displayed on the graph.
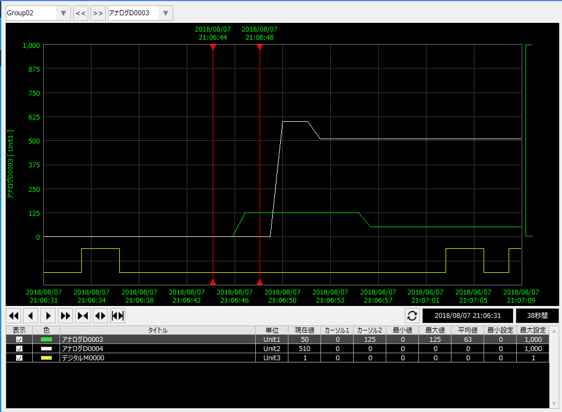
The M0000 pen has a data type of "Boolean" and a plot type of "Trigger".
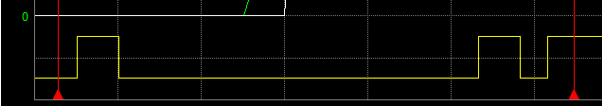
If the plot type is Trigger, the pulse display will be as shown below according to the change in log data (0/1).
For the above, try changing the plot type to "Color bar" from the pen settings.
|
(Select plot type)
|
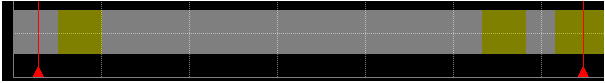
The graph area then changed to a bar-like display as shown below.
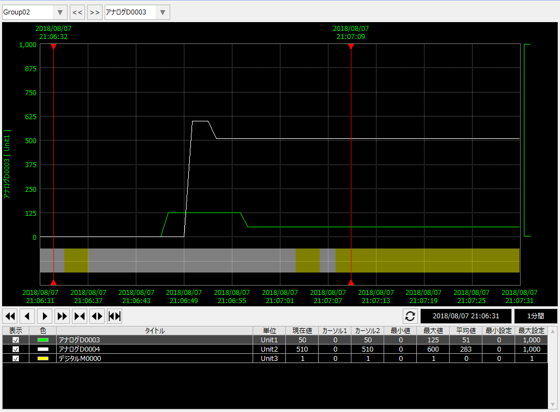
When the plot type is color bar, the log data changes (0/1) and is displayed in different colors as shown below.
Additionally, in the current display, the data type of pen D0003 is "Numeric" and the plot type is "Curve", so it is displayed as a line graph.
So, in the pen settings, change the plot type to "Bar" and set the pen size to "5".
|
(Select plot type)
|
The changed pen will then be displayed as a bar graph, as shown below.