About Tag Field Master
The "Client Configuration Guide" provides a "Client Connection Sample" as an example of connection from FA-Client. This sample has a summary action named "Summary" registered in advance. This action is for logging and aggregation.
Summary actions read the settings from various master files when they are executed, and perform logging and aggregation processing according to the settings. One of the master files for summary actions is the "tag field master", which defines which tags are to be logged and aggregated.
The tag field master for the above "Summary" action is stored below.
(Project folder) \server\summary\fieldmaster_tag.csv
The tag field master is a text file in CSV format and can be freely edited using a text editor such as Notepad or Excel.
The following steps use the sample file above as an example.
Editing Tag Field Master
Below we will explain how to edit tag field masters using Excel.
■ Prerequisites
In the configuration example introduced here, the following tags are assumed to be registered in FA-Server instead of actual tags that communicate with PLC. When actually building a monitoring system, please read these tags as tags that communicate with PLC.
Units used:
Virtual Device (U01)
tag:
Numeric tags from U01.F01.D0000 to D0004 (5 points)
Bit tags U01.F01.M0000 ~ M0004 (5 points)
■Work Instructions
Please open the tag field master "fieldmaster_tag.csv" in Excel.
Then, the following is written:
The first line of the tag field master is the header. It defines what information is written in which column. From the second line onwards, define which tags are to be logged and aggregated, one line at a time. Each line defined here is called a "field", and the name defined in the Name column becomes the field name.
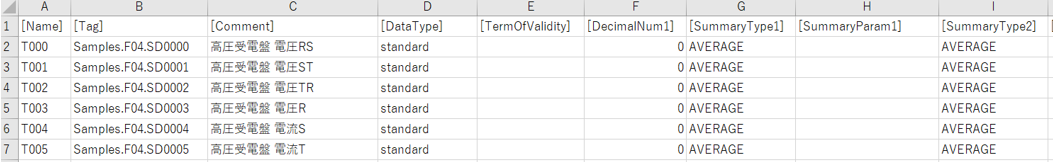
Currently, sample data is registered from the second line onwards. Since we will not be using sample data, please delete all data from the second line onwards.
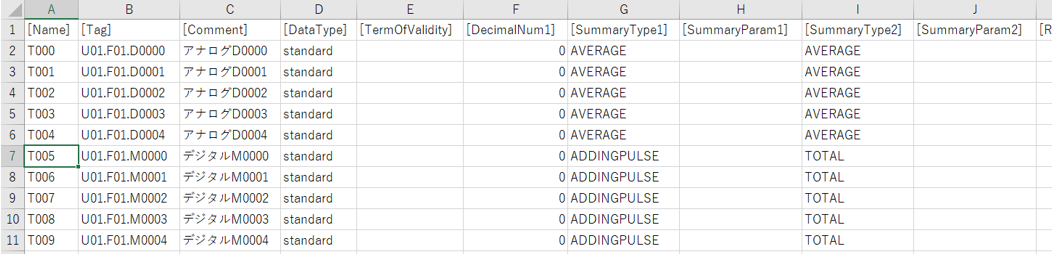
Then, from the second line onwards, add 10 lines of field definitions for five analog points, U01.F01.D0000 to D0004, and five digital points, U01.F01.M0000 to M0004.
Please refer to the following for the settings of each field.
Header Name |
Contents |
[Name]
|
Specify the field name. The field name must be a unique string. In this example, we will specify the field names as sequential numbers from "T000" to "T009". |
[Tag]
|
Specify the tag path of the tag to be logged. As an example, define five points from U01.F01.D0000 to D0004 and five points from U01.F01.M0000 to M0004. |
[Comment]
|
Specify any comment. For ease of understanding, we will use "Analog D0000" and "Digital M0000" here. Furthermore, the content specified in the comment will be displayed in a list when you select a pen on the trend graph. |
[DataType]
|
Specify the data type. In this example, specify all as "standard". In most cases, you will specify "standard" in this field. In other cases, you may specify "powerfactor05" when dealing with power factor. |
[TermOfValidity]
|
This parameter is used for the aggregation function. It is not used in this example. Leave it blank. |
[DecimalNum1]
|
Specify the number of decimal places. In this example, we will set it to all "0". |
[SummaryType1]
|
Specify the aggregation method for daily reports. For example, if you specify "AVERAGE", the average of the data within the period will be calculated.
Representative parameters) AVERAGE: Average TOTAL: Total MAX: Maximum MIN: Minimum ADDINGCOUNT: Accumulation counter (calculates the increment from the cumulative ring counter value) ADDINGPULSE: Accumulated pulse (calculates the number of times it turned ON within a period)
In this example, enter "AVERAGE" for the numeric tags (the five points from U01.F01.D0000 to D0004) and "ADDINGPULSE" for the bit tags (the five points from U01.F01.M0000 to M0004).
|
[SummaryParam1]
|
Depending on the aggregation method specified above, specify parameters as necessary. Not used in this example, leave blank. |
[SummaryType2]
|
Specify the aggregation method for monthly and annual reports. The method specified here is the aggregation method used when the daily report aggregation results are raised to monthly and annual reports. For example, by setting SummaryType1 to ACCINGPULSE and SummaryType2 to TOTAL, the number of times the bit was ON can be found during daily aggregation, and the total number of times the daily report aggregation value was ON can be found during monthly aggregation. As an example, enter "AVERAGE" for the numeric tags (the five points from U01.F01.D0000 to D0004) and "TOTAL" for the bit tags (the five points from U01.F01.M0000 to M0004). |
[SummaryParam2]
|
Depending on the aggregation method specified above, specify parameters as necessary. Not used in this example, leave blank. |
[ReportHeader1]
|
This parameter is used for the daily report function. It is not used in this example. Leave it blank. |
[ReportHeader2]
|
Ibid. |
[ReportHeader3]
|
Ibid. |
[ReportHeader4]
|
Ibid. |
Once you've finished editing, save it as a CSV file.
(Reference: Excel editing image)
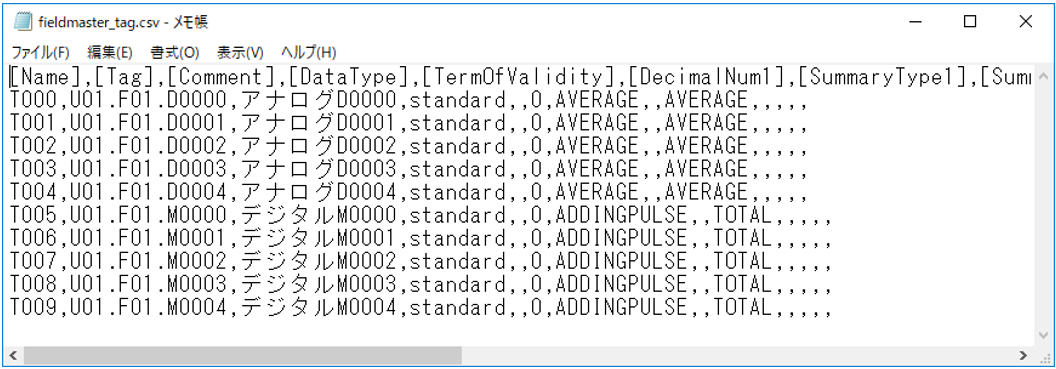
(Reference: Example edited with Notepad)
|
If you want to define multiple languages simultaneously in the master file description (for example, if you want to mix Japanese and Chinese in the comments), be sure to save the file in UTF-8 (with BOM) format. |
|
For details about the Tag Field Master fields, see "Tag Field Master". |
|
For details about the various configuration files for summary actions, see "Summary action configuration files and folder structure". |
Operation check
Once you have configured the tag field master, check the operation of the trend graph.
1.Bring your application online
Run FA-Server online.
Next, start FA-Client.
2.Displaying the trend graph screen
Once FA-Client is launched, display the trend graph from the menu.
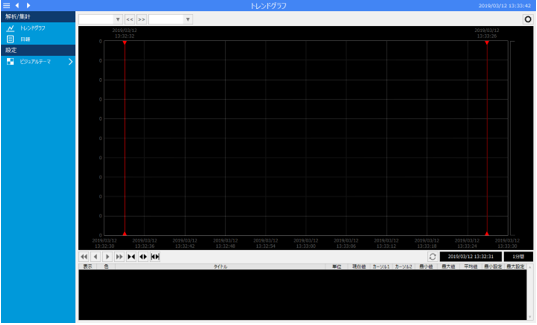
To display the trend graph, you must register the pen.
Currently, no pens have been registered, so nothing is displayed on the graph.
3.Add a pen
Now, let's add a pen to the trend graph. Here, please set up the pen by following the steps below.
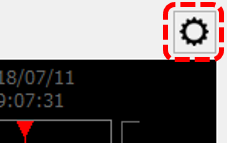
First, click the settings icon (gear icon) in the upper right corner of the screen to display the menu.
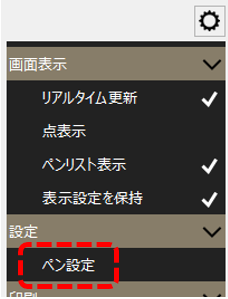
Select "Pen Settings" from the menu displayed on the right side of the screen.
This will bring up the pen settings dialog, where you can set the trend pen settings.
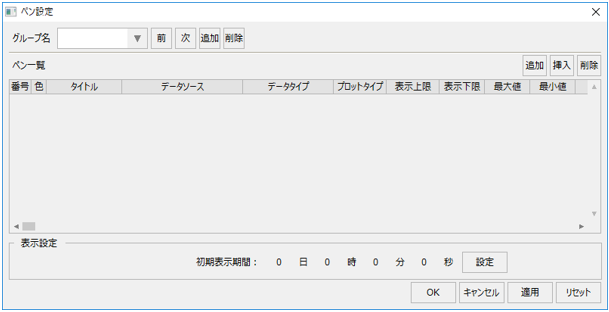
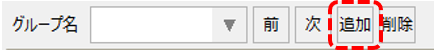
First, add a pen group. To add a group, click the "Add" button to the right of the group name.
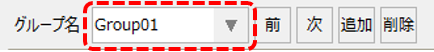
A new group called "Group01" will then be added and displayed in the combo box.
The group name can be edited directly from the combo box, but in this case we will use this name as is.
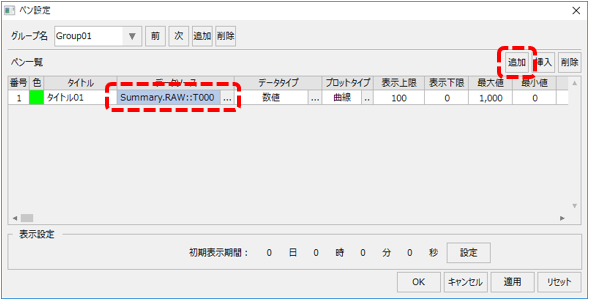
Next, click the "Add" button in the upper right corner of the pen list.
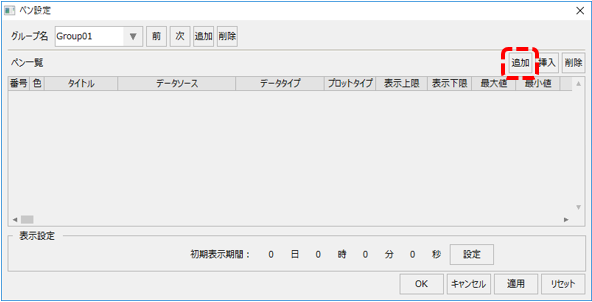
Then, a new line was added to the pen list.
You need to specify a data source for the added pen. To specify a data source, click the selection button in the "Data Source" field of the added line.
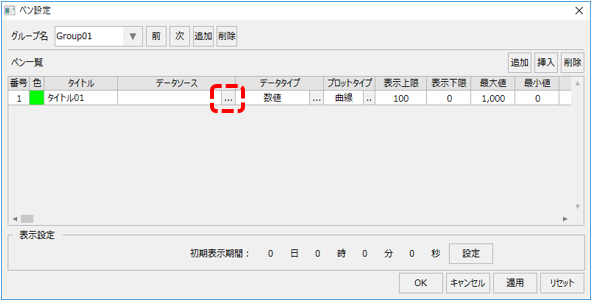
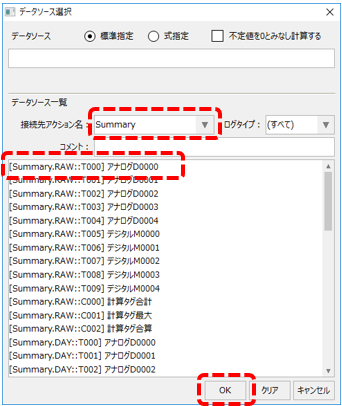
This will display the data source selection dialog.
When you select "Summary" from the destination action name, the selectable data sources will be displayed in the list.
As an example, select the "Summary.RAW::T000" line at the top of the list and click "OK."
The data source will then be selected as shown below. For the purposes of this example, leave the maximum, minimum, and other settings at their default values.
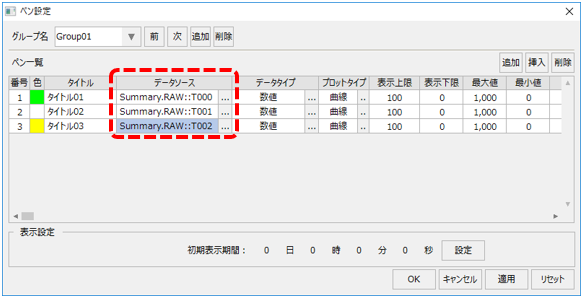
Continue clicking the "Add" button to add two more pens.
Assign "Summary.RAW::T001" and "Summary.RAW::T002" to the data sources of the two pens you added.
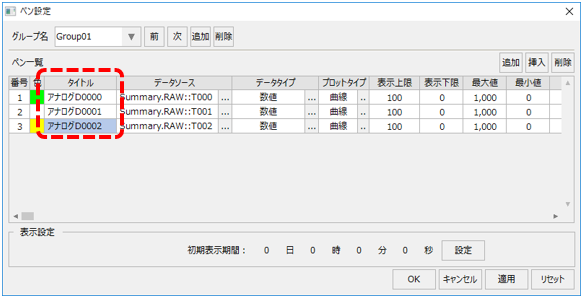
Next, change the pen title to something easier to understand.
To edit the title of a pen, double-click the corresponding cell in the pen list. As an example, change the pen titles to "Analog D0000", "Analog D0001", and "Analog D0002".
When you have finished setting up, click the "OK" button to close the pen settings dialog.
The graph is displayed on the trend graph screen.
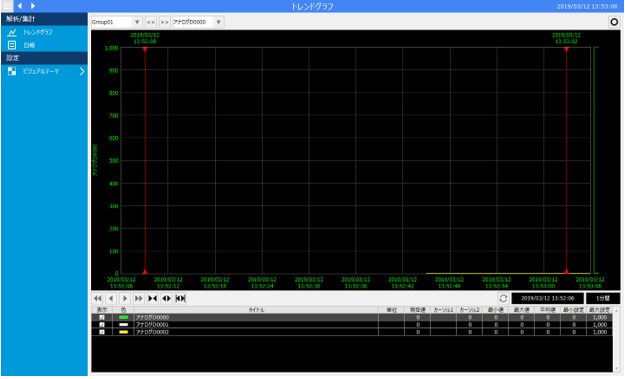
Currently, the tag values have not changed, so all pens remain stable at zero.
4.Change the value of a tag
Now, let's try changing the tag value from FA-Server. Select the F01 folder in the U01 unit, and make sure that tags D0000 to D0002 are displayed in the multiview.
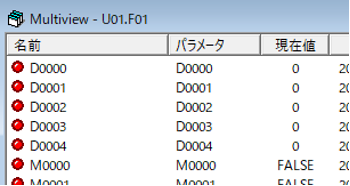
In the multiview, try changing the tag values of D0000, D0001, and D0002 to any value between 0 and 1000. To edit a tag value, select the tag and press the "F5" key to display the write dialog.
The trend graph is now "updated in real time" - notice that the graph display scrolls automatically from right to left and that the graph value changes automatically when the tag value changes.

5.Displaying historical data on a graph
Next, let's try displaying the history of the trend graph.
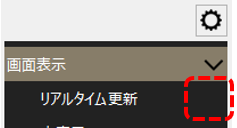
Click "Real-time updates" from the menu on the right side of the screen.
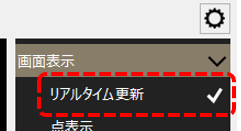
The check mark to the right of real-time update will disappear and the trend graph will stop scrolling. You can switch between these modes by clicking each time.
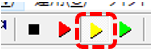
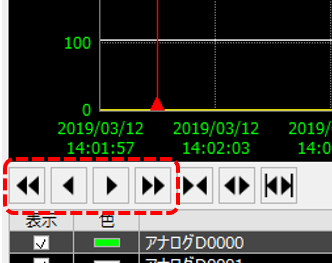
When scrolling of a trend graph is stopped, you can scroll the graph display by clicking the arrow buttons at the bottom of the graph.
Scroll through the graph to see historical data.
supplementary explanation
■ Log data storage period (Summary Master)
The retention period for summary action log data is defined in a configuration file called "Summary Master".
In the sample, the summary master is stored in the following location:
(Project folder) \server\summary\master.txt
The summary master is a text file and can be freely edited with a text editor such as Notepad.
Below is the Summary Master opened in Notepad.
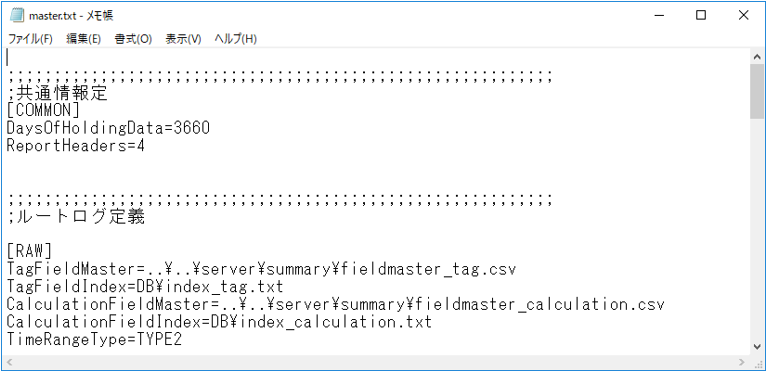
The data retention period is defined in days as "DaysOfHoldingData" in the [COMMON] section. The default is written as shown below, which sets it to 3660 days. You can change the log data retention period by editing this section.
DaysOfHoldingData=3660
In addition, various settings other than the data retention period are defined in the Summary Master, and definitions related to the aggregation process (processing such as daily report aggregation based on log data) are also made in this file.
|
For details on the format of the summary master, see "Summary Master". |
■ About Calculated Field Master
One of the summary action configuration files is a configuration file called "Calculated Field Master."
In the sample, the calculated field master is stored in the following location:
(Project folder) \server\summary\fieldmaster_calculation.csv
A calculated field is a function that allows you to perform calculations between tag fields at the time of aggregation processes such as daily reports using summary actions.
Please note that the sample configuration file may contain sample data such as the following:
When building a monitoring system based on a sample,If you do not use calculated fields, please delete the sample data from the second line onwards in the following definition file..
(Example of a calculated field master)

|
For more information about formatting calculated field masters, see "Calculated Field Master". |