overview
When building a system to monitor the power of power receiving equipment, etc., you may want to log the "power factor" and display it in a graph.
Power factor has a special range of values that differs from general measurement values. When handling power factor in a summary action, it is necessary to check whether the power factor data is received as raw values from downstream devices such as PLC or the power factor range data is received as linear values. Here, the raw power factor value refers to the actual power factor value such as -50 to 100 to +50. On the other hand, a linear value refers to continuous numerical range data such as 0 to 4000. If the data received from the downstream device is 0 to 4000 and is expressed as a power factor of -50 to 100 to +50, it is necessary to convert it and import it, for example, as "-50" for 0, "100" for 2000, and "+50" for 4000.
This section explains how to display the raw power factor value on a trend graph using an example.
|
The "Supplementary Explanation" on this page describes how to convert linear values to power factors using a tag filter and import them, and how to convert linear values to power factors on a graph and display them. Please refer to these as well. |
Download the sample
The creation examples shown on this page are provided with samples.
The sample can be downloaded from below.
Procedure
The following describes how to edit the tag field master to handle the power factor and how to set the pen of the trend graph.
■ Editing tag field master
In the sample, a memory device unit "U01" has already been registered, and one numeric tag, U01.F01.T01, has been registered.
The settings are made assuming that the raw value of the power factor will be entered into this tag.
1.Editing a Tag Field Master
Now, try opening the sample tag field master in Excel.
The tag field master is stored in:
(Project folder) \server\summary\fieldmaster_tag.csv
When you open the above, you will see the following:

The thing to pay attention to here is [DataType] in column D. This is where you set the power factor type.
There are four types of power factor that can be specified as the data type. You must set the appropriate type depending on the type of raw power factor value you want to obtain.
Data Type |
Contents |
powerfactor00
|
Power factor range: -0 to 1 to +0 |
powerfactor05
|
Power factor range: -0.5 to 1 to +0.5 |
powerfactor00p
|
Power factor range: -0 to 100 to +0 |
powerfactor05p
|
Power factor range: -50 to 100 to +50 |
The current tag field master has "powerfactor05p" defined, so the tag value is treated as the raw value (percentage) of power factor from -50 to 100 to +50.
Once you have finished checking, close Excel.
■ Power factor pen settings
Next, run the sample and register the power factor pen from the trend graph screen.
1.Launching the Application
Please bring FA-Server online (yellow arrow) and run FA-Client.
Once FA-Client is started, display the trend graph screen.
2.Setting the Pen for Power Factor
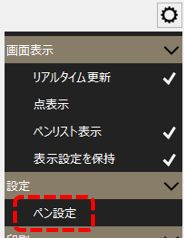
Add a pen to the trend graph. Click the settings icon (gear icon) in the upper right corner of the screen to display the menu, and select "Pen Settings."
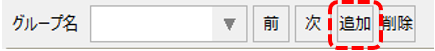
From the pen settings dialog that appears, add a group.
To add a group, click the "Add" button to the right of the group name.
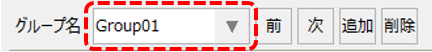
A new group called "Group01" will be added and displayed in the combo box. We will use this name this time.
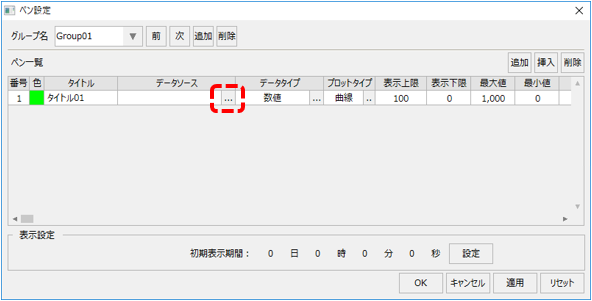
Next, click the "Add" button in the upper right corner of the pen list.
|
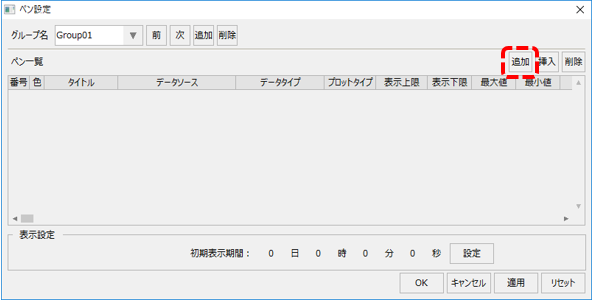
Once a pen has been added to the pen list, specify the data source to be displayed for the pen.
|
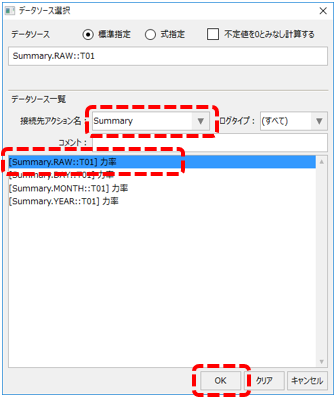
This will display the data source selection dialog.
|
Select "Summary" from the destination action name. Then, the selectable data sources will be displayed in the list.
Select the "Summary.RAW::T01" line at the top of the list and click "OK."
|
The data source has been selected.
|
Next, set the data type to power factor. Click the data type selection button "...". |
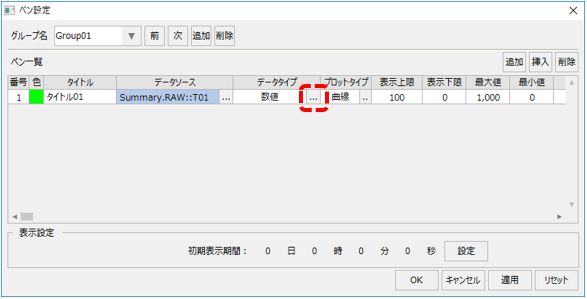
|
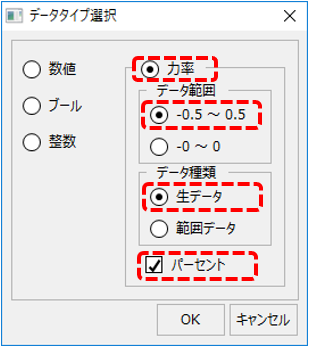
Select the data type as follows:
•Select "Power Factor" •Data range: "-0.5 to 0.5" •Data type: "Raw data" •Percentage: Check
Once you have set it, close it by clicking OK.
|
|
Next, define the minimum and maximum values.
The minimum and maximum values specified here specify the range of values to be displayed as the power factor. Here, specify the maximum value as "50" and the minimum value as "-50".
|
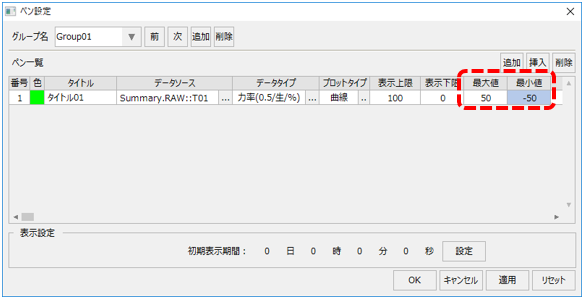
Once you have completed the settings, click the "OK" button to save them.
Operation check
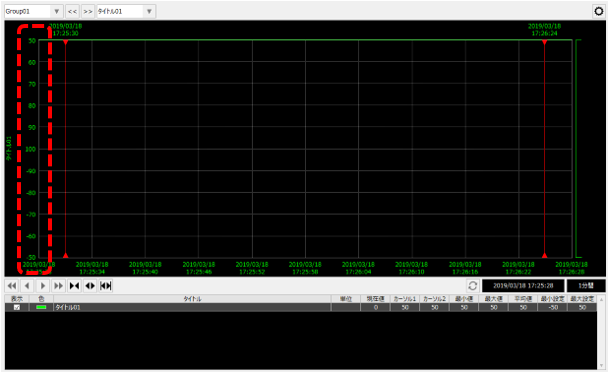
Display the trend graph screen and confirm that the pen you added above is displayed.
Looking at the range displayed on the left side of the graph, the lower limit is -50, the middle is 100, and the upper limit is 50.
Also, since the current tag value is 0, the graph is plateauing at 50.
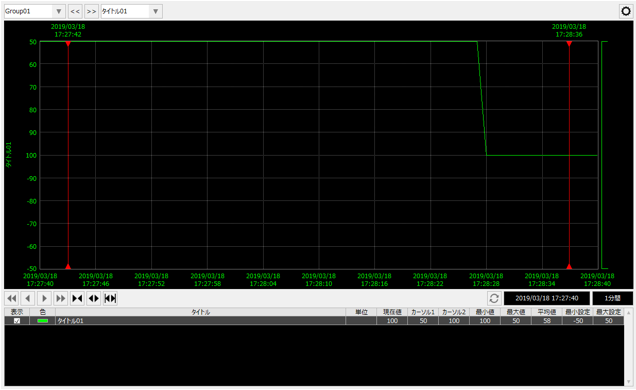
Now, try changing the value of the target tag (U01.F01.T01) from FA-Server to 100.
The graph then showed a power factor of 100% and the line was displayed in the center.
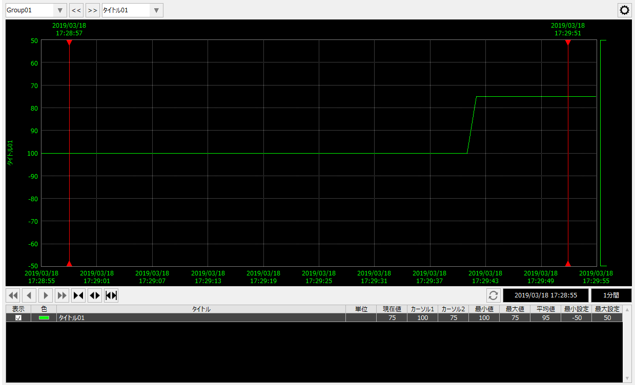
Next, try changing the value of the target tag (U01.F01.T01) from FA-Server to 75.
The graph then showed a power factor of 75%.
■ Converting tag values to power factors and importing them (tag filter)
The above steps explain how to receive the "raw value" of the power factor from the downstream device as a tag, log it, and display it on a trend graph.
On the other hand, when receiving a power factor from a downstream device, it may be necessary to receive it as linear range data. For example, if the data received from the downstream device is 0 to 4000 and is to be expressed as a power factor of -50 to 100 to +50, it must be converted and imported as "-50" for 0, "100" for 2000, and "+50" for 4000.
In such cases, it is useful to use a "tag filter." By using a tag filter, you can import values read from devices such as PLC into tags after performing conversion processing using a specified filter. The tag filter includes a filter for converting linear values into power factors.
Below we will introduce how to set up the tag filter for power factor conversion.
|
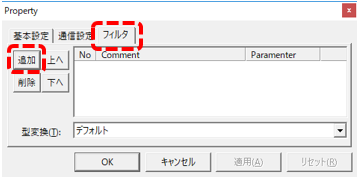
First, open the "Filter" tab in the properties of the tag for which you want to set a filter.
Click the Add button on the Filters tab.
|
|
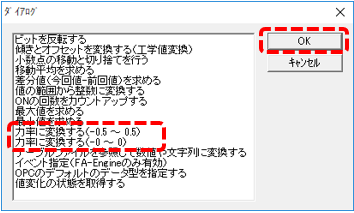
This will display the selection dialog shown on the left.
Select the desired filter from the list and click OK.
As shown on the left, there are two types of power factor conversion. Depending on the type of power factor you want to import, select either -0.5 to 0.5 or -0 to 0. As an example, select -0.5 to 0.5 here.
|
|
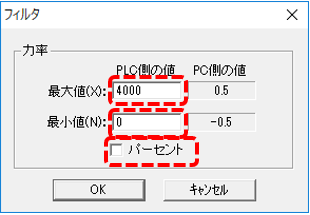
This will display the settings dialog shown on the left.
Set the maximum and minimum values on the PLC side. If you want to import from 0-4000, set it as shown on the left.
If you want to convert the imported power factor to a percentage, check "Percent."
|
■ Convert linear values into power factors and display them on a graph
If for some reason (for example, when importing data logged by another system) the linear value of the power factor is logged instead of the raw value, there is a way to deal with this by simply adjusting the pen settings of the trend graph.
Below we will explain how to configure the pen settings to display linear value log data as a power factor.
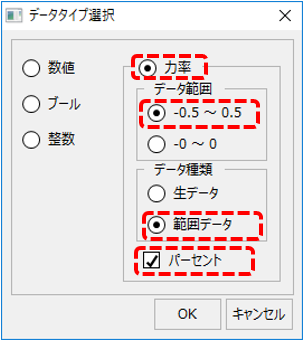
First, set the data type of the pen settings as follows:
|
•Select "Power Factor" •Data range: "-0.5 to 0.5", etc. Select according to the desired type. •Data type: Select "Range Data". •Percentage: Check as necessary.
|
Next, set the maximum and minimum values of the pen.
|
The minimum and maximum values you specify here specify the linear value range of the tag.
For a linear value between 0 and 4000, specify "0" as the minimum and "4000" as the maximum.
|
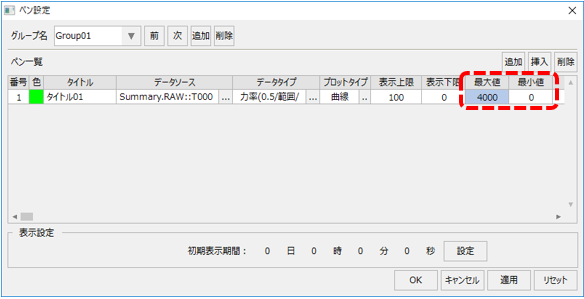
With the above settings, on the trend graph, a value of 0 will be displayed as -50, a value of 2000 will be displayed as 100, and a value of 4000 will be displayed as 50.