|
This document is a reference for the "Daily/Monthly/Yearly Report action", which is a daily report aggregation function of the old version. Daily/Monthly/Yearly Report action is a function that remains for upward compatibility with systems developed in the old version. If you need to build a daily report aggregation / report creation function, please use summary action. |

overview
Here we will explain the simple setup steps for creating a report using the Daily/Monthly/Yearly Report action.
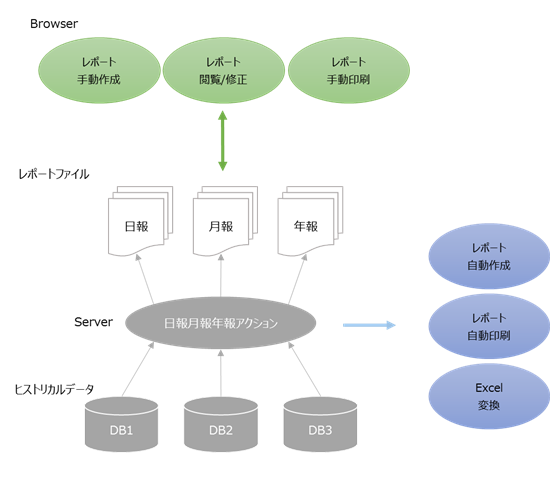
The procedure introduced here can be broadly divided into the following three steps:
Creating a Logger |
Use the Logger Action to save the raw data to a database for reporting purposes. |
|
Action Settings |
Use the Daily/Monthly/Yearly Report action to set up automatic generation of reports on a regular basis. |
|
Viewing Reports |
You can view reports using Daily report grid control in Panel Browser. You can also send printing instructions from Panel Browser. |
An example of this feature is available below.
The logger action retrieves data from PLC and saves the data in a database. Reports can be created manually from Panel Browser, but here we will set it to be created automatically by Panel Server. Reports automatically generated by Panel Server can be viewed from Panel Browser. We will also set it up so that reports can be printed from Panel Browser.
The raw data will be saved in CSV format, and reports will be created from the saved data according to the following format.
Database format: CSV
File name: DByyyymmdd.csv (files are split by day and the date is added)
CSV columns |
type |
data |
0 |
Time Field |
yyyy/mm/dd HH:MM:SS |
1 |
Analog Data |
Number |
2 |
Analog Data |
Number |
3 |
Analog Data |
Number |
4 |
Analog Data |
Number |
5 |
Analog Data |
Number |
6 |
Analog Data |
Number |
7 |
Analog Data |
Number |
8 |
Analog Data |
Number |
9 |
Analog Data |
Number |
10 |
Analog Data |
Number |
In this example, data is saved every 10 minutes.
example)
DB20050101.csv
0 columns |
1 column |
2 columns |
... |
9 columns |
10 columns |
2005/1/1 00:00:00 |
12 |
43 |
... |
20 |
85 |
2005/1/1 00:10:00 |
14 |
46 |
... |
23 |
74 |
... |
... |
... |
... |
... |
... |
2005/1/1 23:50:00 |
12 |
55 |
... |
15 |
68 |
DB20050102.csv
0 columns |
1 column |
2 columns |
... |
9 columns |
10 columns |
2005/1/2 00:00:00 |
25 |
42 |
... |
28 |
77 |
... |
... |
... |
... |
... |
... |
2005/1/2 23: 50:00 |
32 |
36 |
... |
23 |
68 |
1.In step 1, we use the Logger action to save the PLC data to a CSV file.
In this sample, the analog data from SD0000 to SD0009 will be saved to a CSV file at 0 minutes, 10 minutes, 20 minutes, 30 minutes, 40 minutes, and 50 minutes every hour.
time |
SD0000 |
SD0001 |
... |
SD0008 |
SD0009 |
2005/1/1 00:00:00 |
123 |
3 |
... |
45 |
24 |
2005/1/1 00:10:00 |
124 |
4 |
... |
47 |
28 |
2005/1/1 00:20:00 |
125 |
5 |
... |
49 |
37 |
... |
... |
... |
... |
... |
... |
|
Logger Action is a powerful feature for saving PLC data to a database. |

Tag configuration
Follow the steps below to set up tags. Here, we will use a virtual device to simulate a PLC, so PLC is not necessary. If you have PLC at hand, you can set up the PLC tag.
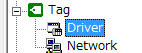
1.Right-click "Driver" in the tree on the left and select "Add Unit"
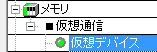
2.Select "Memory", "Virtual Communication" and "Virtual Device" and press "OK"
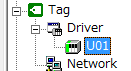
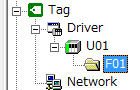
3.Right-click "U01" and select "Add Folder"
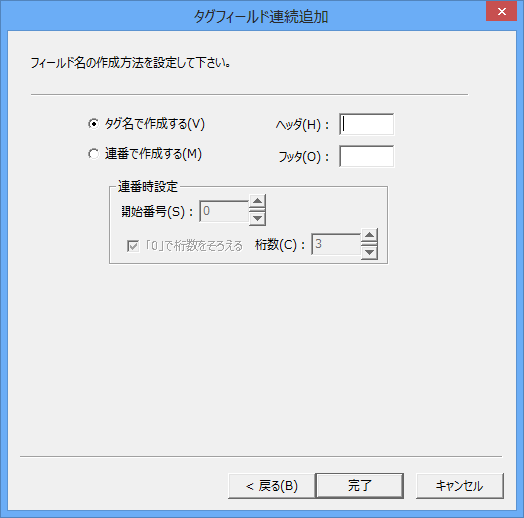
4.Right-click "F01" and select "Add Tags Continuously"
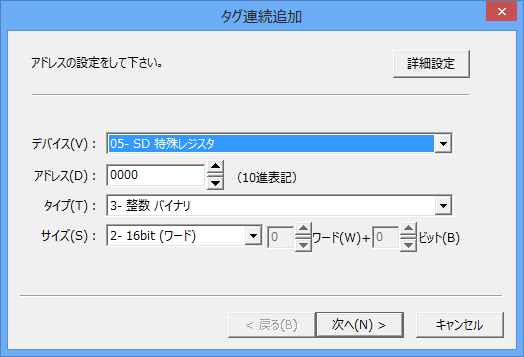
5.Select "SD Special Register" and click "Next"
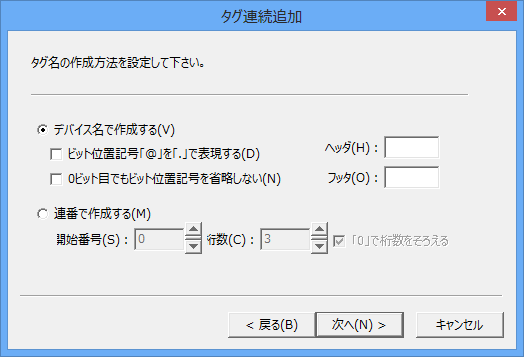
6.Click "Next" without setting anything.
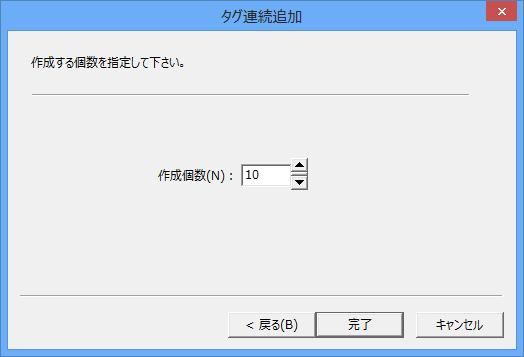
7.Set "Number to create" to 10 and click "Done"
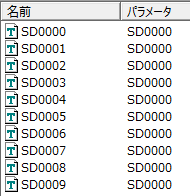
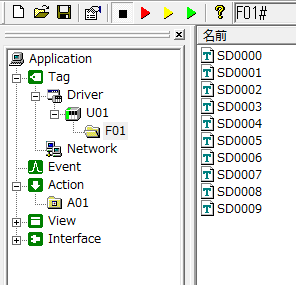
Ten numeric tags will be created, from
SD0000-SD0009 (the value of SD will change automatically at runtime).
Action Settings
1.Right-click "Action" in the tree on the left and select "Add" and "Action" from the menu.
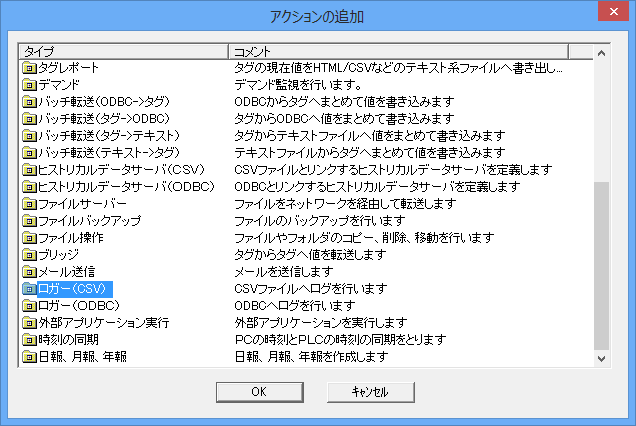
2.Select "Logger (CSV)" from the Add Action dialog and press "OK"
3.Right-click on "A01" and select "Properties"
Set as follows and press "OK"
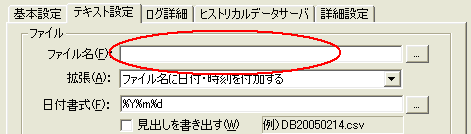
・Here, set "File name" to "DB.csv".
4.Right-click "A01" and select "Add" and "Time Field."
A time field "F01" is added within "A01".
5.Select all tags and drag and drop them onto "A01"
6.Click the "Next" button to move to the next step, then select "Finish"
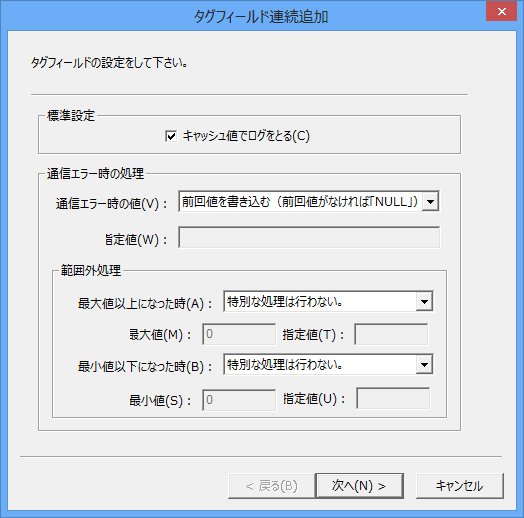
Fields from "U01_F01_SD0000" to "U01_F01_SD0009" will be created.
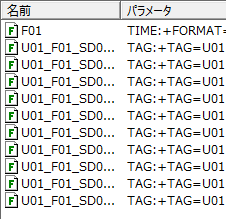
The above fields are the format of the CSV file. The time field is written out first, followed by the values SD0000 to SD0009, separated by commas. If you want to change the order of the fields, right-click on the field and move it up or down from the menu.
Event Settings
Create an event to call the logger action created above.
1.Right-click on "Event" in the tree on the left and select "Add" and "Scheduled event" from the menu.
"E01" is added inside "Event".
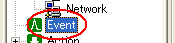
2.Right-click "E01" in the list on the left and select "Properties"
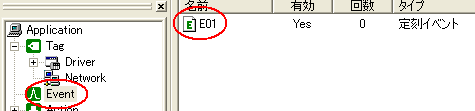
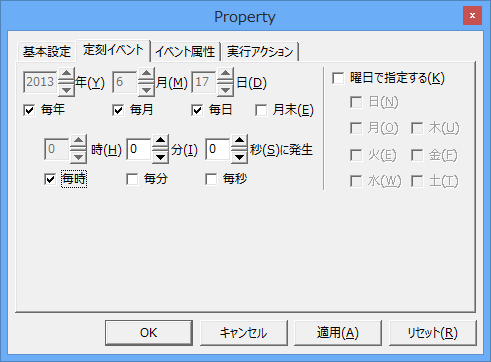
3.Set the event to occur at 0 minutes past every hour in the "Scheduled event" tab
Check every year, month, day, hour and make sure it is at 0 minutes
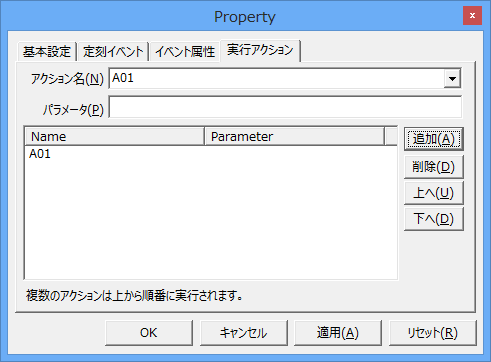
4.Register "A01" on the "Execution Action" tab
This setting will execute "A01" at the top of every hour.
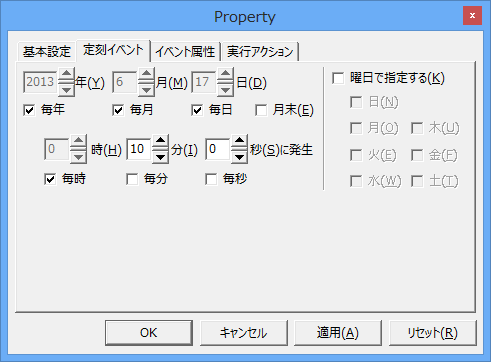
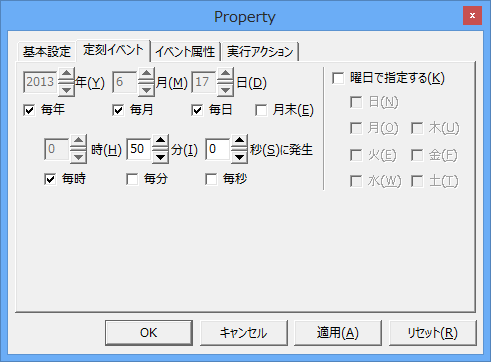
5.Add five more events (E02 to E06) and register them to execute "A01" at 10 minutes past the hour, 20 minutes past the hour, 30 minutes past the hour, 40 minutes past the hour, and 50 minutes past the hour.
First, select E01, copy it with Ctrl-C, and then press Ctrl-V five times to copy it, and you can easily create E02 to E06. After creating the copy, set the 10th, 20th, ... 50th minutes from the Scheduled event tab of each event. With this setting, PLC data will be saved to the CSV file at 0 minutes, 10 minutes, 20 minutes, 30 minutes, 40 minutes, and 50 minutes every hour.
E02
…
E06
Operation check (logger action)
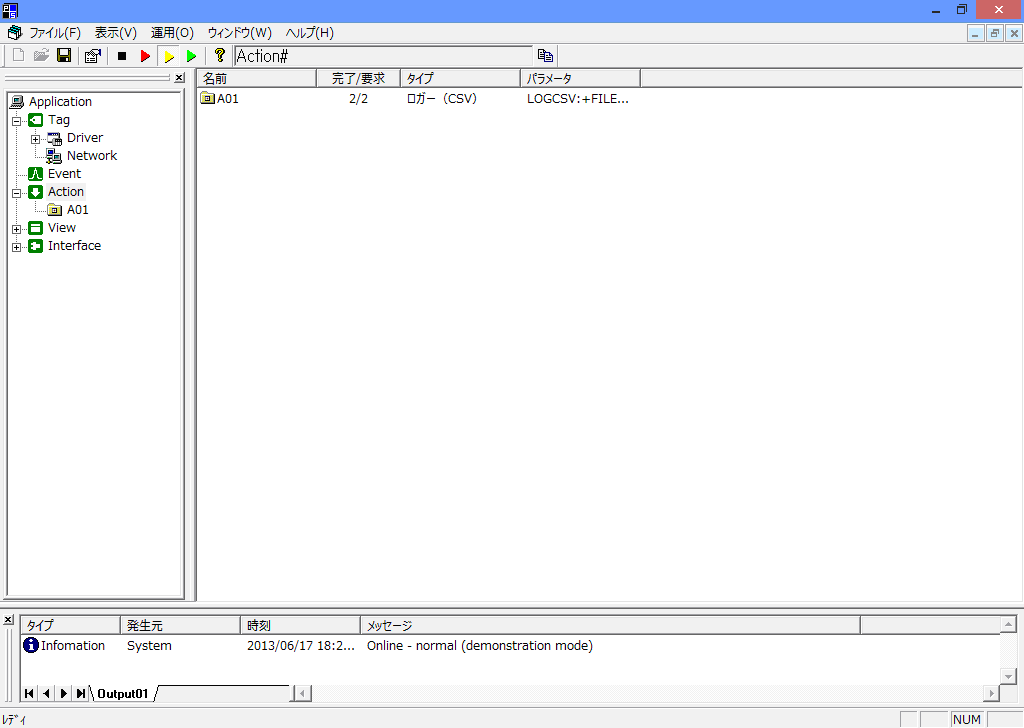
After pressing the "Online Monitor" button (yellow button), click "Action" in the tree on the left, and the number of times it has been executed will be displayed in the list on the right. It is OK if this number is incremented every hour, 0 minutes, 10 minutes, 20 minutes, 30 minutes, 40 minutes, and 50 minutes.
File verification
Once the execution count has been incremented, press the "Stop" button (black button) to stop the log.
Make sure that a file named "DByyyymmdd.csv" has been created in the specified folder, then open the file and check the contents to make sure that the log has been properly recorded.
|
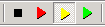
Panel Server has three online states. Red: Online (Debug) Communicates virtually. Use when you do not have a PLC at hand. Yellow: Online (Monitor) Current values can be checked and set in the application. Green: Online (fastest) The application will disappear and appear as an icon on the taskbar. |
In step 2, we will use the Daily/Monthly/Yearly Report action to set up a report to be created based on the raw data prepared in step 1.
Configuring Daily/Monthly/Yearly Report actions
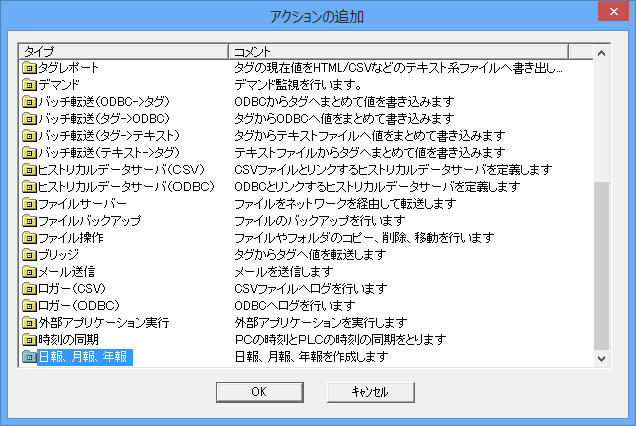
1.Right-click "Action" in the tree on the left and select "Add" and "Action" from the menu.
2.Select "Daily/Monthly/Yearly Report" from the Add Action dialog and click "OK"
3.Right-click on "A02" and select "Properties"
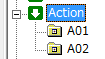
4.Set the following in the "Basic Settings" tab and click "OK"
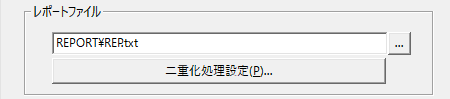
・Here, the "File name" is set to "REP.txt". (※Please set the path where you want to save the report file.)
5.Set the "Daily Report", "Monthly Report", and "Annual Report" tabs as follows and click "OK".
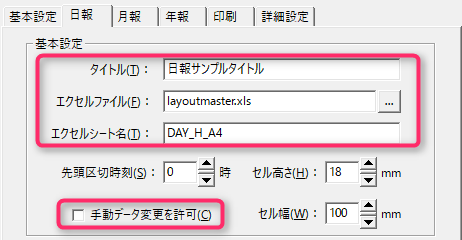
Specify the report title and layout master file. Here, we will use the sample layout master "layoutmaster.xls". Also, uncheck "Allow manual data changes" to prevent clients from changing the report.
・Daily report title: "Daily report sample title"
Daily report Excel file (layout master): layoutmaster.xls
Daily report Excel sheet name: DAY_H_A4
・Monthly report title: "Monthly report sample title"
Monthly report Excel file (layout master): layoutmaster.xls
・Monthly report Excel sheet name: MONTH_H_A4
・Annual report title: "Annual report sample title"
Annual report Excel file (layout master): layoutmaster.xls
・Annual report Excel sheet name: YEAR_H_A4
|
The layout of Daily/Monthly/Yearly Report can be organized in one Excel book. In actual development, it is more efficient to copy the layout from the sample reportmaster.xls with an appropriate name, and then edit and reuse the layout freely in Excel. |
6.Set the following in the "Print" tab and click "OK"
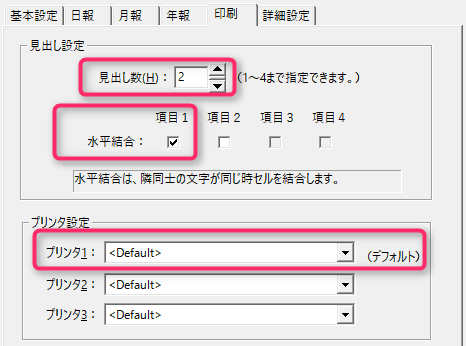
・Number of headings: 2
Horizontal join: Check item 1
・Printer 1: If necessary, set the printer. If the default printer set in the OS is OK, there is no need to set anything.
7.Add a Tags field
Tag fields are settings for associating and setting the aggregation method for each data item included in historical data in order to aggregate it into a report. Add a tag field for each piece of data you want to aggregate and configure it individually. First, add one tag field. Right-click "A02" from the tree and select "Add" and "Tag Field".
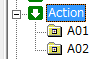
A tag field "F01" has been added within "A02".
8.Set the properties of the tag field "F01"
●Basic Settings tab
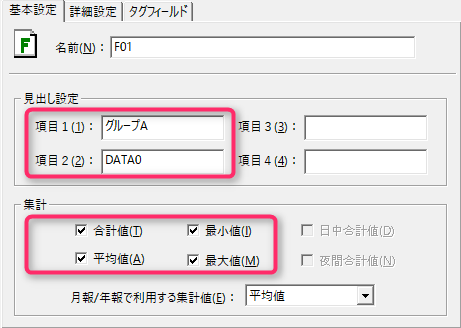
・Item 1: "Group A"
・Item 2: "DATA0"
・Aggregation: Check the sum, average, minimum, and maximum values
●Advanced Settings tab
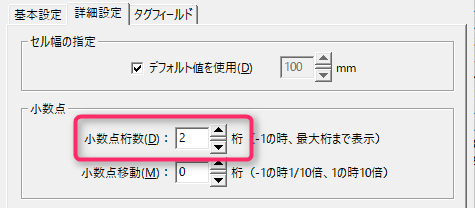
- 2 decimal places
●Tag Field Tab
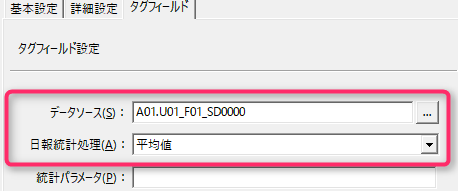
Data source: A01.U01_F01_SD0000
・Statistical processing: Average value
*For the data source, specify the "U01_F01_SD0000" column in the CSV file set in the logger action.
9.Similarly, add tag fields "F02" to "F10" and set their properties.
* It is more efficient to first add a total of nine "F01"s by copying and pasting them, and then change the settings.
field |
Item 1 |
Item 2 |
totalling |
Decimal Point |
Data Source |
Statistical Processing |
F01 |
Group A |
DATA0 |
Check all |
2 digits |
A01. U01_F01_SD0000 |
Average |
F02 |
Group A |
DATA1 |
Check all |
2 digits |
A01. U01_F01_SD0001 |
Average |
F03 |
Group B |
DATA2 |
Check all |
2 digits |
A01. U01_F01_SD0002 |
Sum |
F04 |
Group B |
DATA3 |
Check all |
2 digits |
A01. U01_F01_SD0003 |
Sum |
F05 |
Group C |
DATA4 |
Check all |
2 digits |
A01. U01_F01_SD0004 |
Start value |
F06 |
Group C |
DATA5 |
Check all |
2 digits |
A01. U01_F01_SD0005 |
Start value |
F07 |
Group D |
DATA6 |
Check all |
2 digits |
A01. U01_F01_SD0006 |
Median time value |
F08 |
Group D |
DATA7 |
Check all |
2 digits |
A01. U01_F01_SD0007 |
Median time value |
F09 |
Group E |
DATA8 |
Check all |
2 digits |
A01. U01_F01_SD0008 |
Final Value |
F10 |
Group E |
DATA9 |
Check all |
2 digits |
A01. U01_F01_SD0009 |
Final Value |
10.Customize daily report layout
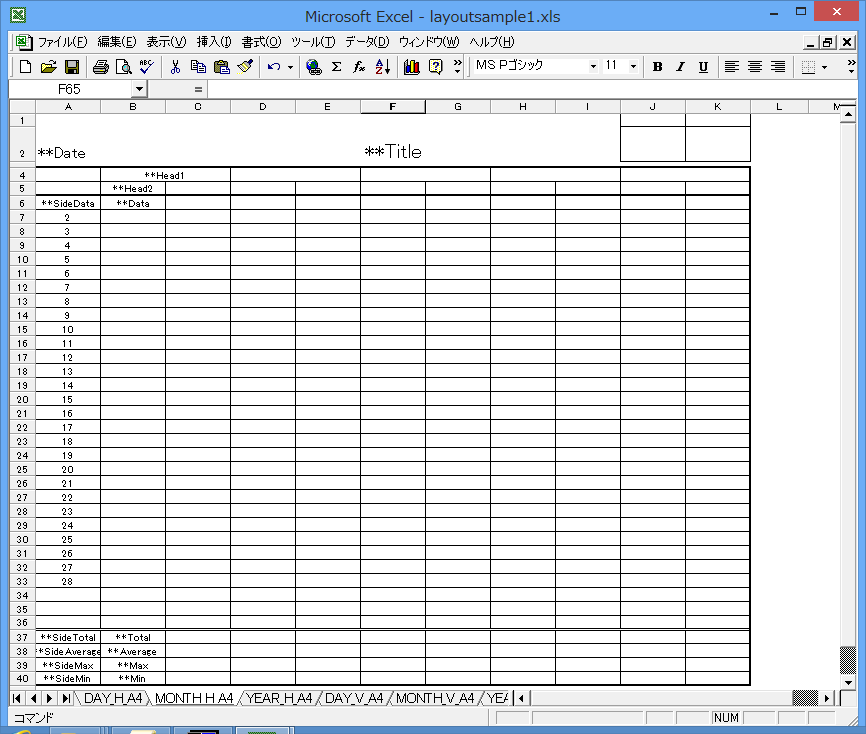
The layout of the currently used layout master "layoutmaster.xls" has already been changed for the sample. To create a layout master for actual development, copy it from the template "reportmaster.xls" with an appropriate name, and then freely edit the layout such as color, border, number of columns in Excel. Therefore, we will continue to explain how to customize the layout, assuming that it has just been copied from reportmaster.xls with the name layoutmaster.xls. When it has just been copied from "reportmaster.xls", the number of columns for data is 12. Since only 10 columns are needed this time, delete the unnecessary 2 columns (if it is OK to leave it as it is with 12 columns and print 2 columns as blank, it is fine to leave it as it is).
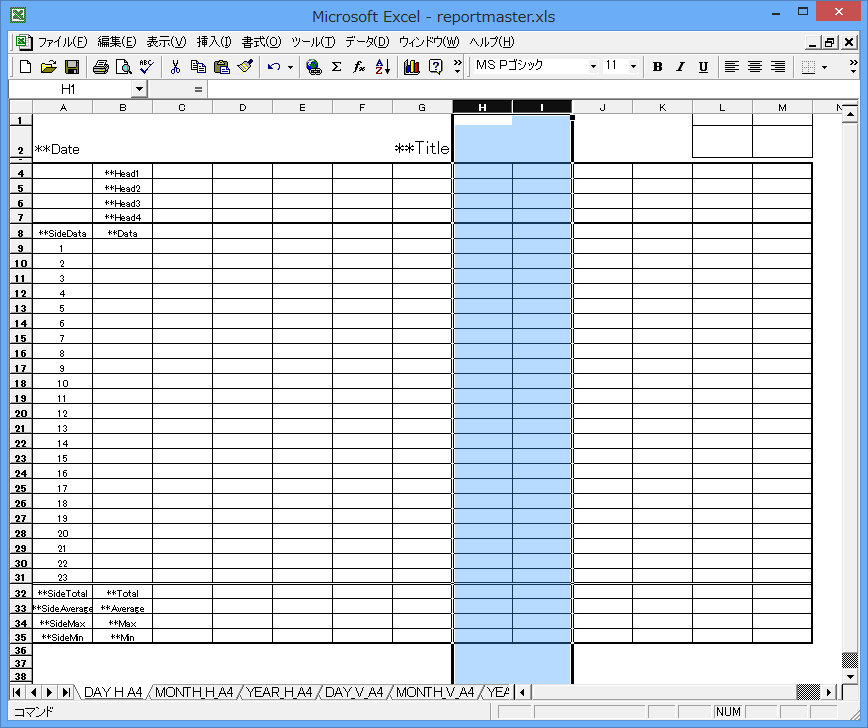
Work example)
To delete, select columns H and I, and select "Edit" and "Delete." Move the title "**Title" to "F2." Adjust the column width while checking the overall size with "File" and "Print Preview."
Also, there are four header lines ("**HEAD1" to "**HEAD4") in the initial state. In this setting, the number of header lines is set to "2", so delete two unnecessary header lines (if you are OK with four lines, you can leave it as it is).
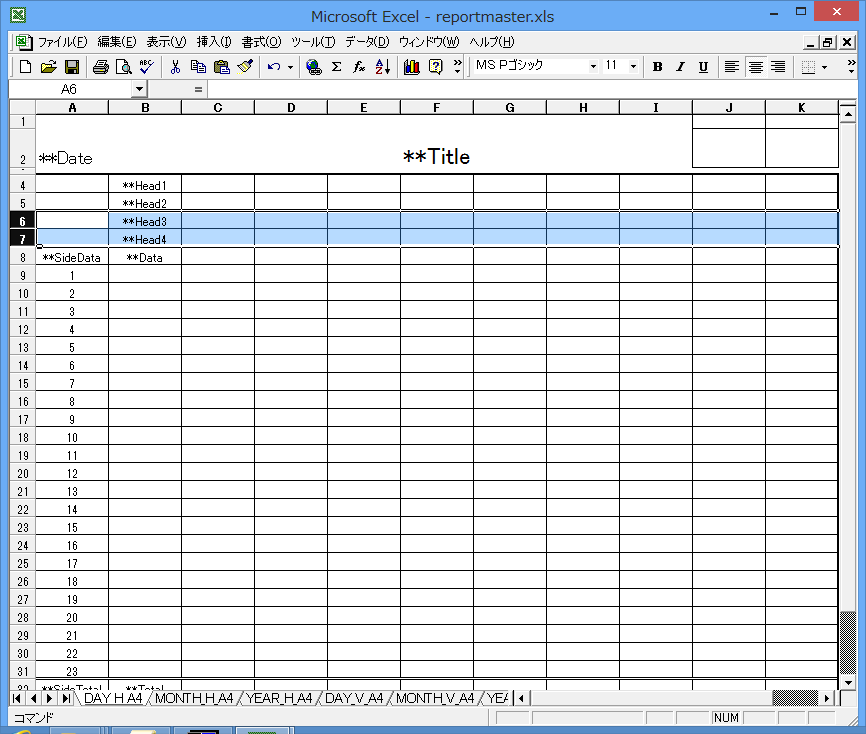
Work example)
To delete, select lines 5 and 6, then select "Edit" and "Delete." Change "**Head4" to "**Head2." Adjust the line width while checking the overall size with "File" and "Print Preview."
Also, in item 1 (**HEAD1), groups A to E are set to be merged horizontally, so the following cells will be merged.
Group A: B4: C4
Group B: D4: E4
Group C: F4: G4
Group D:H4:I4
Group E: J4: K4
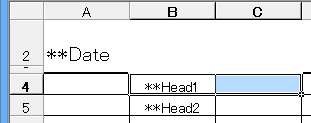
Work example)
Select
B4 and C4, select Excel menu "Format" "Cells", and check "Merge Cells" in the "Alignment" tab of the dialog. Do the same for cells in groups B to E.
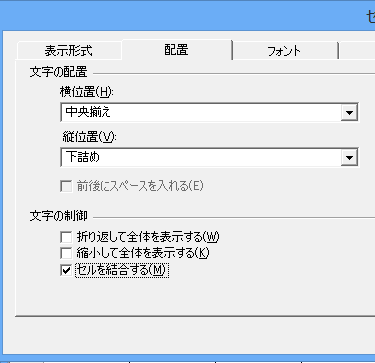
11.Similarly, customize the layout of the monthly report sheet "MONTH_H_A4".
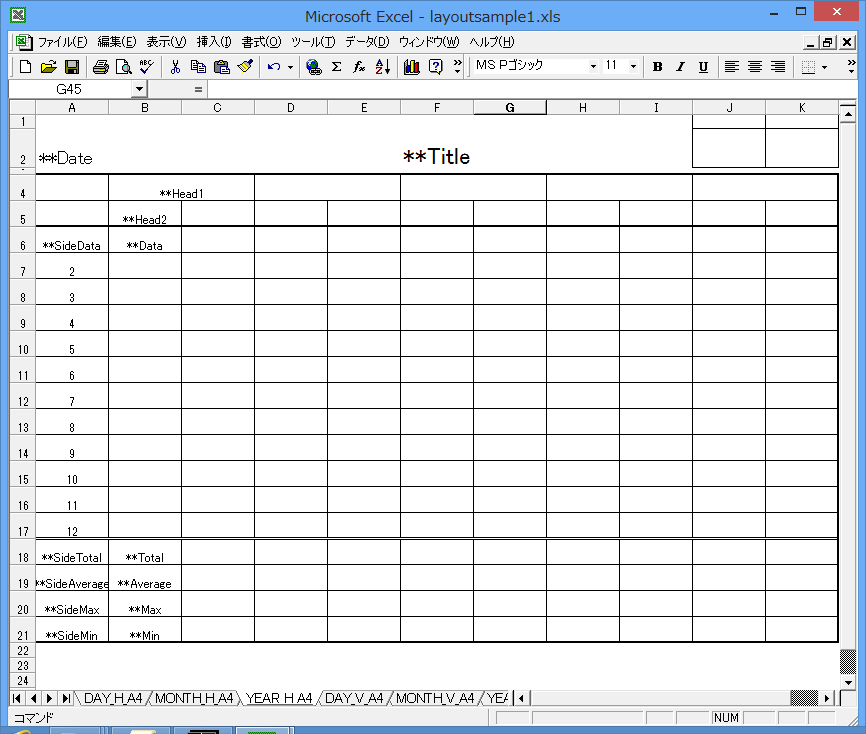
12.Similarly, customize the layout of the annual report sheet "YEAR_H_A4"
Setting Scheduled event
Here, we will set up the automatic creation (automatic aggregation) of Daily/Monthly/Yearly Report. When created, the daily report will be aggregated based on the raw data. The report can be recreated and re-aggregated as many times as you like. Here, we will set it up so that you can always view the latest situation, even during the day.
Daily report: Automatically generated every hour (1 minute after every hour) to create the latest daily report.
Monthly report: Automatically created every day (at 12:01am) to create the latest monthly report.
Annual report: Automatically generated every month (at 12:01 on the 1st of each month) to create the latest annual report.
The above is just an example, and you can freely set the timing of report creation depending on your operation method. You can also set it so that reports are not generated automatically (in that case, create the target report manually when viewing the report). In addition to creating reports, you can also automatically print and maintain them (delete old reports).
1.Check that the settings in the previous chapter have been completed
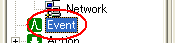
2.Right-click on "Event" in the tree on the left and select "Add" and "Scheduled event" from the menu.
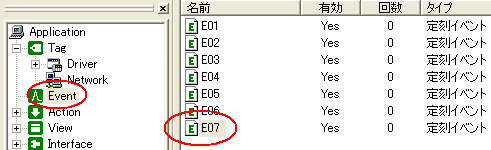
"E07" will be added inside "Event".
3.Right-click "E07" in the list on the left and select "Properties"
4.Set the following in "Scheduled event"
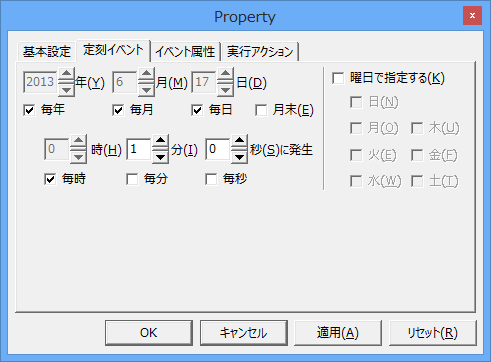
- Yearly/Monthly/Daily/Hourly: Check
・minutes: 1
5.Define the call to "A02" in the "Execution Actions" tab
Enter "CREATE(DAY,NOW-10M,NOW-10M,0)" in the
parameter. This setting creates a daily report at 1 minute past the hour.
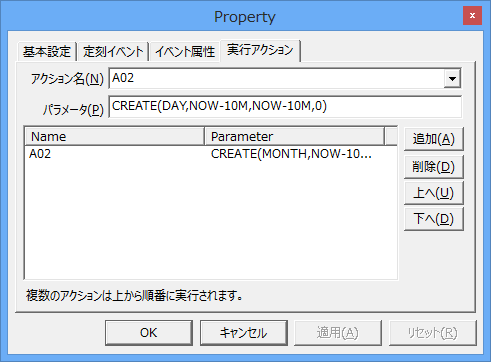
The report creation parameters have the following format:
CREATE( report type, creation start time, creation end time, excluding those for which aggregation has been completed)
Report Type: YEAR - Annual Report MONTH - Monthly Report DAY - Daily Report
Start Creation Time: The date when report creation should start (in relative time format)
End Creation Time: The date when you want to end the report creation (in relative time format)
Exclude counting completed: 0 - Regenerate counting completed 1 - Exclude counting completed
The start time and end time are set to "NOW-10M", i.e. "10 minutes before the event occurs". This is an example of a device that creates a daily report for the current day every hour until the day changes, and then creates a daily report for the previous day at the change of day.
(*Daily reports are calculated by the specified date. Time is not taken into account.)
|
For information on relative time formats, see "Relative Time Formats". In addition to CREATE, you can also use the PRINT/ MAINTENANCE parameters to automatically print reports and automatically delete old daily report files. |
6.Similarly, add "Scheduled event", "E08", and "E09" and set them as follows:
"E08's Scheduled event tab"
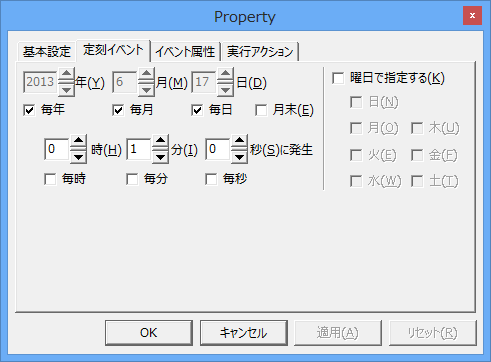
・Every year/Every month/Every day: Check
・Hour: 0
・minutes: 1
"E08 Execution Action Tab"
・Action name: A02
Parameter: CREATE(MONTH,NOW-10M,NOW-10M,0)
※Don't forget to press the Add button.
"E09's Scheduled event tab"
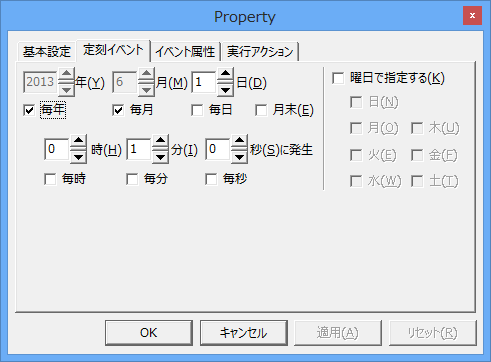
- Yearly/Monthly: Check
・Day: 1
・Hour: 0
・minutes: 1
"E09 Execution Action Tab"
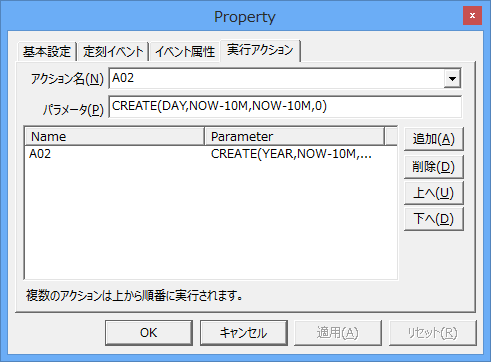
・Action name: A02
Parameter: CREATE(YEAR,NOW-10M,NOW-10M,0)
※Don't forget to press the Add button.
Confirm Action
After pressing the "Online Monitor" button (yellow button), click "Action" in the tree on the left, and the number of times it has been executed will be displayed in "A02" in the list on the right. It is OK if this number is incremented every hour, 1 minute past midnight, every day, and 1 minute past midnight on the 1st of every month.
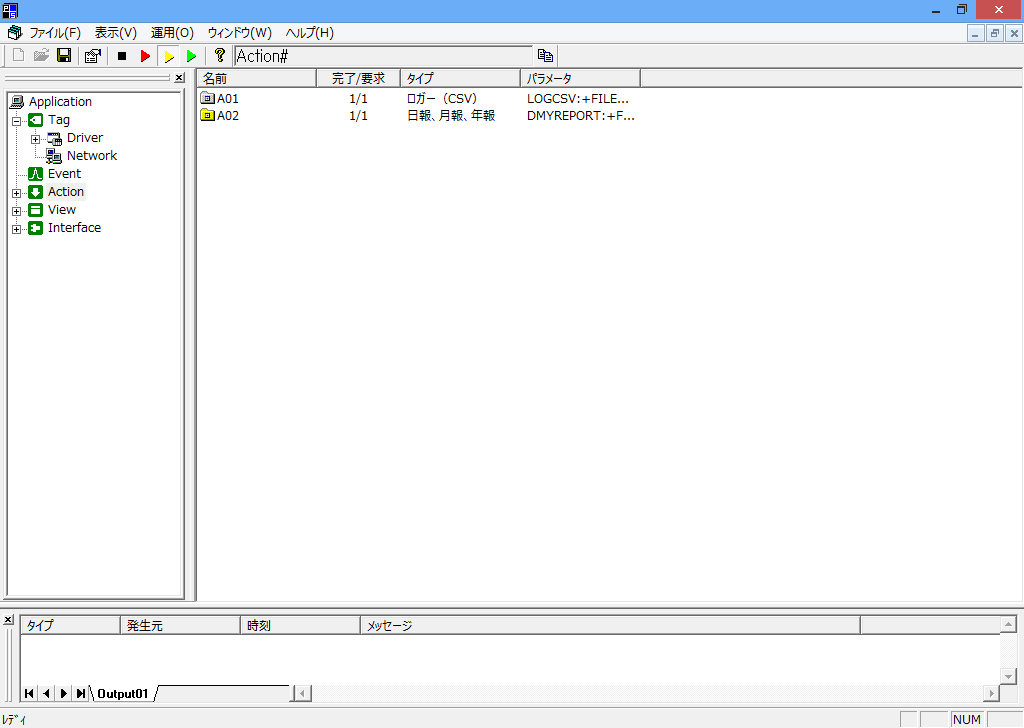
File verification
Once the execution count has been incremented, press the "Stop" button (black button) to stop the log. Check that a file named "REPyyyymmdd.txt" has been created in the folder specified in the report settings, and that a daily report file has been created or updated every hour at 1 minute, a monthly report file at 12:01 every day, and an annual report file at 12:01 every month.
|
Panel Server has three online states. Red: Online (Debug) Communicates virtually. Use when you do not have a PLC at hand. Yellow: Online (Monitor) Current values can be checked and set in the application. Green: Online (fastest) The application will disappear and appear as an icon on the taskbar. |
Step 3 (Daily report grid control)
In step 3, you will use Daily report grid control to enable Daily/Monthly/Yearly Report reports automatically generated by Panel Server to be viewed and printed in Panel Browser.
Daily report grid control settings
Set Daily report grid control in Panel Editor. In this sample, we will create a daily report screen with the following functions.
1)Display Daily/Monthly/Yearly Report in Daily report grid control
2)Print button
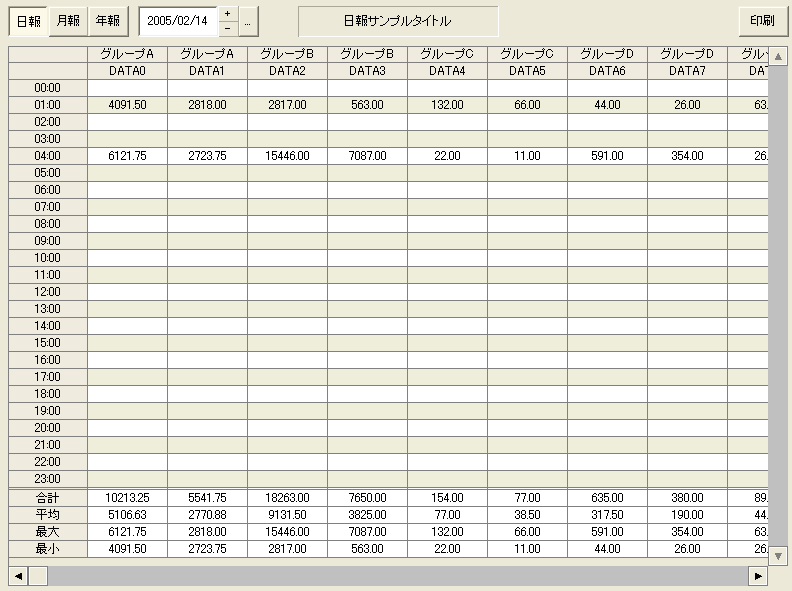
|
This screen is just a sample. You can add various other functions to the screen to create your own form screen. |
1)Display Daily/Monthly/Yearly Report in Daily report grid control
To display Daily/Monthly/Yearly Report on Daily report grid control, simply connect to the Daily/Monthly/Yearly Report action on Panel Server using the Connect method and then call the following method (for details about GridLoadReport, see "Daily report grid control").
GridLoadReport (ReportType, Date [, bCreateFile = FALSE] [, bWithoutComplete = TRUE]) |
Example: Displaying today's daily report
this.GridLoadReport("day", #now#);
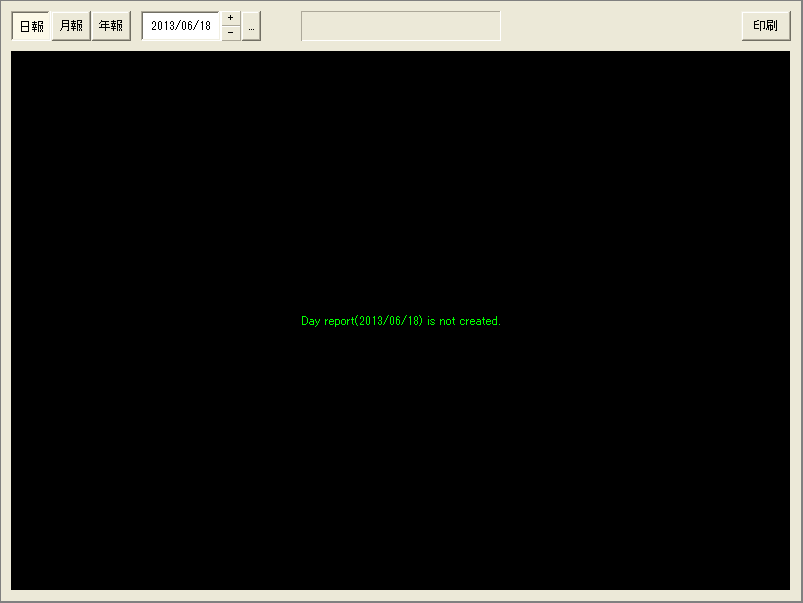
Specify the date and time you want to display in Date. For daily reports, the date and time specification is valid up to the day, and any hours, minutes, or seconds specified will be ignored. Similarly, for monthly reports, the date and time specification is valid up to the month, and for annual reports, the date and time specification is valid up to the year, and any other specification will be ignored. In this case, if the daily report has not yet been generated on the server side, or if the server side is not set to automatically generate daily reports, the daily report file does not exist, and the following screen will be displayed.
*"DayReport(YYYY/MM/DD) is not created" A message is displayed stating that the daily report has not been created.
If the daily report file does not exist and you want to create it at the same time as calling GridLoadReport, call it by specifying TRUE for bCreateFile as shown below. Also, by specifying TRUE for bWithoutComplete, the report will not be created if the daily report is already completed.
Example: Display today's daily report. If the report has not been created, create it.
this.GridLoadReport("day", #now#, TRUE, TRUE);
In this sample, a user-defined function (LoadReport) is defined in the form script to display the report. This user-defined function is called from the edit control or calendar for entering a date, and the report for the specified date is displayed.
function LoadReport(date, bCreate, bWithoutComplete)
{
	::ShowWaitCursor(T);

	SetDefaultHeight();
	this.Report.GridLoadReport(GetReportType(), date, bCreate, bWithoutComplete);
	this.Date.Text = ::CTimeStr(date, "%Y/%m/%d");
	this.TitleLabel.Text = this.Report.ReportTitle;

	::ShowWaitCursor(F);
}

function GetReportType()
{
	var reporttype;
	if (this.DayBtn.SwitchValue == TRUE)
	{
			reporttype = "day";
	}
	else if (this.MonthBtn.SwitchValue == TRUE)
	{
			reporttype = "month";
	}
	else if (this.YearBtn.SwitchValue == TRUE)
	{
			reporttype = "year";
	}
	return reporttype;
}
|
ShowWaitCursor sets the mouse to an hourglass cursor. GridLoadReport takes time (several seconds) especially when creating a report, so we recommend using ShowWaitCursor to set the mouse to an hourglass cursor. In this sample, bCreate is called with all FALSE, and it is processed quickly, so it is not particularly noticeable. |
|
"this.Report.DefaultHeight = xxx;" adjusts the cell height for each report type. In particular, the height of monthly reports is made smaller because they have more rows than daily and annual reports. Daily report grid control has a scroll bar function, so if you do not want to adjust the height for each report, delete it. |
2)Print button
Pressing the print button below will send a print command to Panel Server. The Daily/Monthly/Yearly Report action on Panel Server will receive the command and print the report.

event OnMouseUp(button)
{
	parent.Report.PrintReport(parent.GetReportType(),
				parent.Date.Text, parent.Date.Text, F, F);
}