Daily/Monthly/Yearly Report (Old feature)

<< Click to Display Table of Contents >>

Manual > Server Creation Guide > Action Edition > Action Reference >

Daily/Monthly/Yearly Report (Old feature)

Features of this action


attention

Daily/Monthly/Yearly Report Actions are an old feature that remains in place to maintain backward compatibility with older versions. If you need to build a daily report aggregation or report creation function, please use Summary Actions.


attention

Daily/Monthly/Yearly ReportActions have operating environment restrictions and only work with the 32-bit version of FA-Panel. Although you can add/edit actions in the 64-bit version, they will not work.


The Daily/Monthly/Yearly Report action is for creating a Daily/Monthly/Yearly Report report.


This action is an old specification function developed in versions prior to Ver4, and is retained for backward compatibility with older versions. On the other hand, summary actions are a new feature added in Ver5, and have been expanded in various ways, including the aggregation function of Daily/Monthly/Yearly Report.


If you are considering building a daily report aggregation function, please use Summary Actions.For more information about summary actions, see Summary.


Comparison with Summary Actions


Action

Summary Actions

Logging feature

This action does not have built-in logging functionality, and must be used in conjunction with a separate logger action (i.e., the logger action must be run in conjunction with the Daily/Monthly/Yearly Report action).

Summary Action has a built-in logging function. Because the logging process and the aggregation process work together, it has been improved to perform the aggregation process more efficiently.

Change the form layout (column order, etc.)

You cannot change the form layout while online.

You can freely change the report layout (which fields are displayed and printed on which page) while online from the settings screen of the Panel Browser report screen.

Adding and deleting columns after operation begins

You can only add to the end of a column. You cannot delete columns.

You can freely add, remove, and insert columns in the logging aggregation.


Layout Master File

Layout Master files are Excel files that define the layout used when printing Daily/Monthly/Yearly Report. Excel is required to change the layout during development, but after the layout has been determined, Excel does not need to be installed on the PC that is actually used.


"reportmaster.xls" is provided as a template for the layout master file (located in "\\sample\report"). Usually, you copy "reportmaster.xls" and customize it to your own layout, but you can also create a new file with Excel. "reportmaster.xls" contains the following sheets:


Sheet Name

explanation

Number of Headings

Number of data columns

DAY_H_A4

A4 landscape for daily reports

4

12

MONTH_H_A4

For monthly reports in landscape format (A4)

4

12

YEAR_H_A4

For annual reports in landscape format (A4)

4

12

DAY_V_A4

A4 portrait size for daily reports

4

8

MONTH_V_A4

A4 portrait monthly report

4

8

YEAR_V_A4

A4 portrait annual report

4

8


In the layout master file, you can link report data by embedding "keywords" in Excel cells. A keyword is a string that begins with "**", and when the report is displayed/printed, the actual data is replaced with the embedded keyword and output. For example, there are predefined keywords such as "**Title" for the report title.


The keywords are as follows. With the following keywords, data will be inserted in the order of the fields specified in the action. If you select "Automatically break pages after every specified number of fields" in the "Page Break" setting on the Daily/Monthly/Yearly Report tab, page breaks will be automatically inserted and the data will be printed in the order of the fields.


keyword


**Date

The date of the report.

**Title

The title of the report.

**Head1 ~ **Head4

Header title.

**SideData

For daily reports, the time. For monthly reports, the day. For annual reports, the month.

**Data

Aggregated data.

**SideTotal

The title of the total value. "TOTAL".

**SideAverage

The title of the average value. "AVERAGE".

**SideMax

The title of the maximum value. "MAX".

**SideMin

The title of the minimum value. "MIN".

**Total

The total value.

**Average

Average value.

**Max

Maximum value.

**Min

The minimum value.

**Total1

Intraday totals.

**Total2

Nighttime total value


Also, by adding an index, you can directly specify which field to insert for each column. Use this when you want to freely set the order of fields or whether to show or hide fields for each page. Normally, when using the following keywords, select "Print the specified number of pages" in the "Page breaks" setting on the Daily/Monthly/Yearly Report tab (see "Laying out reports that span multiple pages" for details).


keyword


**Head1[index] ~ **Head4[index]

Header title.

**Data[index]

Aggregated data.

**Total[index]

The total value.

**Average[index]

Average value.

**Max[index]

Maximum value.

**Min[index]

The minimum value.

**Total1[index]

Intraday totals.

**Total2[index]

Nighttime total value

*For the index in [index], specify the field number starting from 1. For example, if 10 fields are defined and you want to print the 5th field, use **Data[5].


You can also embed the following keywords outside the print range and use Excel functions such as "= formula" to freely layout data (the following keywords have three "*"s at the beginning). If you write the following keywords in a Excel cell outside the print range, the value will be embedded starting from the cell immediately to the right. Use "=N30" etc. to embed the value in the cell where you actually want to print. However, to use a formula, Excel must be installed on the PC where Panel Server is running. For details, see "If you want to use graphs, formulas, etc. in the layout master file" below.


keyword


***Head1 ~ ***Head4

Header title.

***SideData

For daily reports, the time. For monthly reports, the day. For annual reports, the month.

***Data

Aggregated data.

***Total

The total value.

***Average

Average value.

***Max

Maximum value.

***Min

The minimum value.

***Total1

Intraday totals.

***Total2

Nighttime total value


The layout master file supports the following Excel settings and formats.

Text / Text format / Cell format / Borders / Paper size / Print orientation / Header / Footer / Page direction (left to right / top to bottom) / Bitmap file


Attention

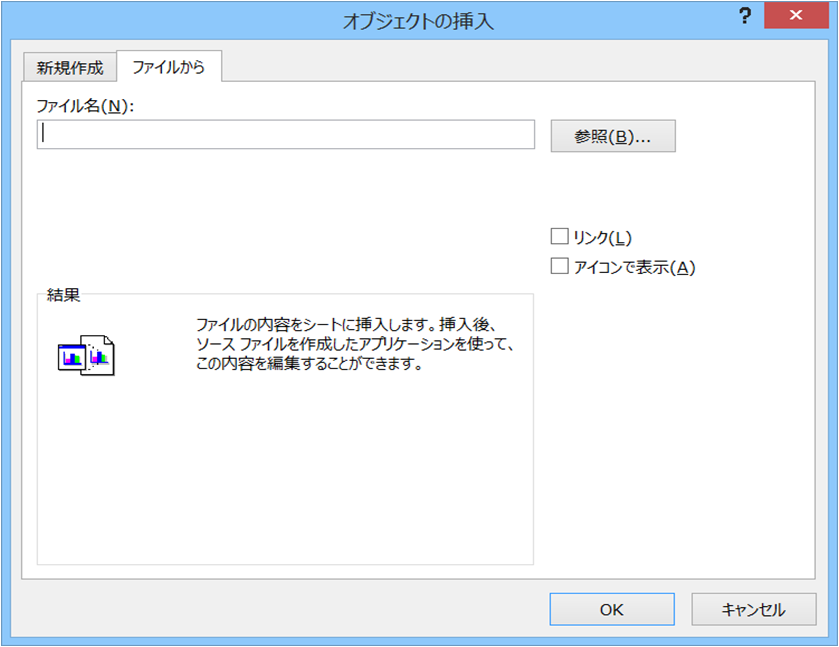
To embed a bitmap, select "Insert" and "Object" from the Excel menu, and insert the bitmap using the "From File" tab. If you do not do this, the bitmap will not be displayed when printed.

c_action_0331


Action Settings

The settings for this action are explained below.


Action specifications

Parameters

You can specify parameters for the action to be executed from the event that calls this action.


c_action_logger_0118


Parameter Characters

Operation

CREATE

Specify this if you want to create a report.


The specification format is as follows:


CREATE(Report Type, Start time, End Time, Excluding items for which counting has been completed)


The parameters are as follows:

Report Type

YEAR - Annual Report

MONTH - Monthly report

DAY - Daily Report

Creation start time

The date (in relative time format) from which the report should start

Creation end time

The date (in relative time format) to end the report generation

Excluding items for which counting has been completed

0 - Regenerate even if the aggregation has already been completed
1 - Exclude items that have already been counted


Hint

For the creation start time and creation end time of CREATE, the time is ignored for the daily report. For the monthly report, the day and time are ignored. For the annual report, the month, day and time are ignored. The same applies to the print start time and print end time of PRINT.


Hint

If you select "Exclude those that have already been compiled," the compilation process will not be executed if the compilation process has already been completed. "Compiled" means that compilation is performed after the compilation date, compilation month, or compilation year has passed. For example, if the daily report for the current day is compiled at 12:00 PM, it is not yet considered to be "compiled." The previous day's report will only be considered to be "compiled" when compilation for the previous day is performed the following day.


Hint

If "Create this subreport when compiling the report" is checked in the settings dialog for each subreport, the subreport will also be generated when CREATE is called. If daily reports are compiled every hour, creating a Excel subreport at the same time will place a heavy load on the system. In such a case, uncheck "Create this subreport when compiling the report" and create a Excel subreport once a day using CREATESUB as an event. Alternatively, you can not normally create Excel subreports, but instead create them on demand when the operator presses a button on the screen, for example, by calling the CreateSubReport method of Daily report client control.

c_action_0332


Hint

For information on relative time formats, see "Format".


CREATESUB

Specify this if you want to create a subreport. Call this if you want to create a subreport later without checking "Create this subreport at the same time as the report is calculated."


The specification format is as follows:


CREATESUB(Report Type, Start time, End Time, Subreport Index)


The parameters are as follows:

Report Type

YEAR - Annual Report

MONTH - Monthly report

DAY - Daily Report

Creation start time

The date (in relative time format) from which the report should start

Creation end time

The date (in relative time format) to end the report generation

Subreport Index

The 1-based index of the subreport.


Hint

Subreport indexes are numbered in the order they are defined, starting from 1. If you want to create multiple subreports with CREATESUB, list the indexes with ";".


Example: If you want to print subreports with indexes 1 and 3.


  CREATESUB(DAY, NOW-1D, NOW-1D, 1;3)


Hint

CREATESUB does not perform aggregation processing. Be sure to call CREATESUB after the aggregation processing is completed with CREATE. Even if "Create this subreport at the same time as the report is aggregated" is not checked in the setting dialog of each subreport, the subreport will be generated when CREATESUB is called.


PRINT

Specify this when you want to print the report.


The specification format is as follows:


PRINT(Report Type, Print start time, Print end time, Printer Number)


The parameters are as follows:

Report Type

YEAR - Annual Report

MONTH - Monthly report

DAY - Daily Report

Print start time

The date (in relative time format) of the report to start printing

Print end time

The date (in relative time format) to end printing the report

Printer Number

0 - Default printer

1 to 3 - The printer registration order number registered in the OS


MAINTENANCE

Specify this when you want to automatically delete report files.


The specification format is as follows:


MAINTENANCE(Report Type, Report retention period)


The parameters are as follows:

Report Type

YEAR - Annual Report

MONTH - Monthly report

DAY - Daily Report

Report retention period

Number of days to keep reports. Files older than the specified number of days will be deleted when called with this parameter.


dialog

■ Basic settings


c_action_0065


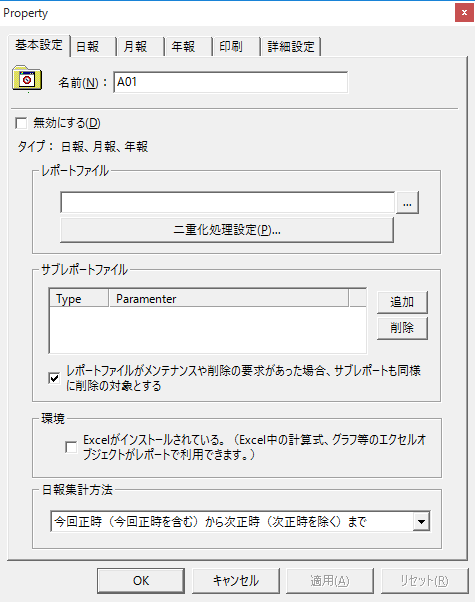
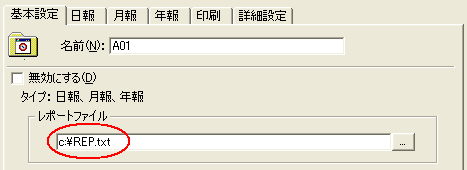
▪Report File
When an instruction to create a report is received, this action determines the file name from this setting and creates a report file.
c_action_0327
 
Daily report creates a report file for each day, and the date is added to the end of the file name in the YYYYMMDD format.
For monthly reports, a report file is created for each month, and the date is added to the end of the file name in the YYYYMM format.
For annual reports, report files are created for each year, and the date is added to the end of the file name in the YYYY format.
 
Example) If the report file setting is "C:\REP.txt"
The daily report file for February 1, 2016 will be "C:\REP20160201.txt".
The monthly report file for February 2016 will be "C:\REP201602.txt".
The 2016 annual report file will be in "C:\REP2016.txt".
 
These files can be automatically deleted in order from oldest to newest by the maintenance function. For details, see MAINTENANCE in "Daily/Monthly/Yearly Report Action Execution Parameters".
 

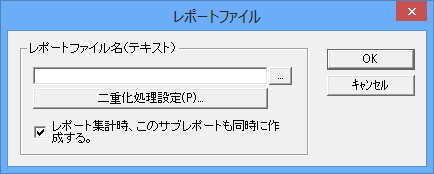
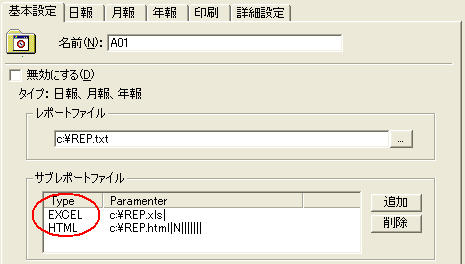
▪Subreport File
Subreports are a feature that allows you to create Daily/Monthly/Yearly Report as Excel or HTML files.
 
c_action_0325
 
If you set a subreport, the subreport will be generated at the same time as the report file when an instruction to create a report occurs. If multiple formats are specified as the subreport, all of the subreports will be created at the same time as the report file. The file name is created according to the same rules as the report file; for example, in the case of a daily report, a report file is created each day and the date is added in the YYYYMMDD format. Monthly and annual reports are created in the same way as the report file.
 
Example) If the subreport (Excel format) setting is "C:\REP.xls"
The daily report file for February 1, 2016 will be "C:\REP20160201.xls".
The monthly report file for February 2016 will be "C:\REP201602.xls".
The 2016 annual report file will be in "C:\REP2016.xls".
 
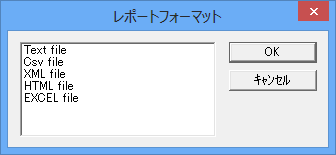
You can select from five formats: Text, XML, HTML, Excel, and CSV. To output Excel subreports, Microsoft Excel2000 or later must be installed.
 
c_action_0326
 
You can receive the subreport file you created from the server using your browser, and open it in the Excel or Web browser. You can view and print the subreport, as well as modify it and send it back to the server.
 
Furthermore, by using subreports, the following operations become possible:


•When printing a report from a browser in an environment where the server is running on a remote PC, if you want to print from the client PC (the PC where the browser is running) without using a printer connected to the server, you can open the subreport Excel file on the client PC and use the Excel function to print from the printer connected to the client.


•Reports are viewed in Excel, approvals and notes are added in Excel, and then the reports are sent back to the server.


attention

If full-width characters are used in the path or file name of a subreport, the subreport may not be created depending on the characters.


▪Excel is installed
If you want to use Excel functions such as graphs, formulas, and some autoshapes (rectangles, circles, text) in a layout master file, Excel must be installed on the PC you are actually using. If you want to use Excel objects in an environment where Excel is installed, be sure to turn on the following setting in the Basic Settings tab of the "Daily/Monthly/Yearly Report" action.
c_action_0328


▪Daily report calculation method
You can choose from the following two options as the time division for the daily report aggregation method.
 

1.From the current hour (including the current hour) to the next hour (excluding the next hour)
00:00 Collect data from 00:00:00 to 00:59:59
01:00 Collect data from 01:00:00 to 01:59:59
・・・


2.From the previous hour (excluding the previous hour) to the current hour (including the current hour)
00:00 Collect data between 23:00:01 and 00:00:00
01:00 Collect data between 00:00:01 and 01:00:00
・・・


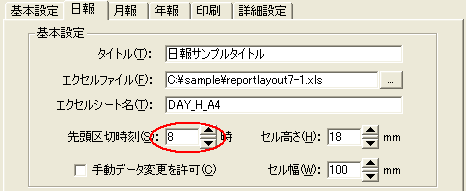
Also, if you want to start daily report calculations from 8:00 a.m., or annual report calculations starting from April, you can change the settings for the first division time and the first division month. This setting is set in the "First division time" on the tab of each report.

c_action_0329


Hint

Daily/Monthly/Yearly ReportWhen specifying the CREATE action as an event, care must be taken when specifying a delimiter other than 0 for the creation start time and creation end time. For example, if you specify 8:00 as the first delimiter time for the daily report, the daily report must be compiled after 8:00. If you want to compile the daily report every day at 8:10, specify #NOW-8H-20M# or #DAY-1M# as the creation start time and creation end time. Furthermore, if the first delimiter time for the monthly report is the 10th, the monthly report must be compiled after 8:00 on the 10th of each month. If you want to compile the monthly report at 8:10 on the 10th of each month, specify #NOW-10D-8H-20M# or #MONTH-1M# as the creation start time and creation end time. Furthermore, if the first delimiter time for the annual report is April, the annual report must be compiled after 8:00 on April 10th of each year. If you want to have the annual report compiled at 8:10 on April 10th every year, specify the start and end times as #NOW-4MO-10D-8H-20M# (see note below) or #YEAR-1M#.


attention

When calculating on the 31st, you cannot use relative times that include subtracting months for NOW (e.g. #NOW-1MO#, etc.). This is because if the month before the 31st has only 30 days, an error will occur and processing will not be possible.


■Daily/Monthly/Annual Reports


c_action_0066


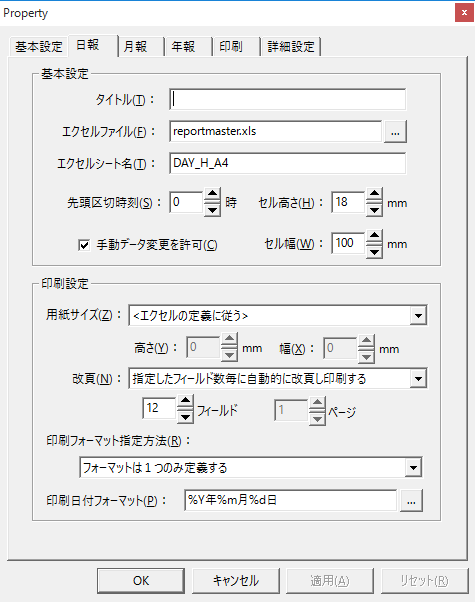
▪title
The title to be used when printing.
 

▪Excel file
Specify the Excel file name that will be the layout master file.
For details, please refer to "Layout Master File".
 

▪Excel Sheet Name
The name of the sheet containing the daily report layout.
For details, please refer to "Layout Master File".
 

▪First separator time
For details, please refer to "Daily report compilation method".
 

▪Allow manual data changes
Check this box if you want to be able to change the daily report from the screen.
 

▪Cell height and width
Specifies the cell height and width when displaying the daily report on the screen.
(*This setting is ignored for the FA-Panel report client Grid control. Height and width are set in the control properties.)
 

▪Paper size, height, width
Size of paper to print. If you select "", the paper will be determined according to the printer settings in the layout file.
 

▪Page break
Page break setting for the report.
 
There is no particular limit to the number of fields (tag fields, calculated fields, constant fields) that can be set in a report. However, if you define many fields that do not fit on one page, you will need to set a layout that is divided into multiple pages.
 

item

Operation

Automatically break pages after each specified number of fields before printing

A page break will automatically occur at the specified number of fields. For example, if 100 fields are defined in the action, and the number of fields is set to 20, a page break will occur every 20 fields, resulting in a report printed on 5 pages. The fields will be printed in the order defined in the action. By default, a page break will occur every 12 fields.


Print a specified number of pages

The specified number of pages will be forcibly printed. In this case, you must select "Define the format for each page on one sheet" or "Define the format for each page on a separate sheet" in "Print format specification method" and define the format for the number of pages. The advantage of this method is that you can freely set the order of fields and the visibility of fields for each page. Since automatic page breaks using **Data cannot be used, you must use **Data[x] for each field and specify the field you want to embed in each column.


▪How to specify the print format
For a layout that spans multiple pages, you can choose from the following five methods for setting the print format of the Layout Master file.


•Define only one format

•Define the first and second formats on one sheet

•Define the format for each page on one sheet

•Define the first and second formats on separate sheets

•Define the format for each page on a separate sheet


If you want to define two or more formats, select "Define the first and two subsequent formats on separate sheets" or "Define a format for each page on a separate sheet."

For example, if you want to print a stamp column only on the first page and not need a stamp column on the second page and after, select "Define the first and second formats on separate sheets" and prepare one sheet each for the layout of the first page and the second page and after, and define the format for each. At this time, be sure to add a consecutive number starting from 1 to the end of the sheet name of each sheet (for example, "DAYREPORT1", "DAYREPORT2", etc.). Then, in the "Excel sheet name" specified in the properties of the daily report action, specify the sheet name without the number at the end ("DAYREPORT" in the above example). This setting allows you to separate the layout of the first page from the layout of the second page and after.


attention

You can combine formats on one sheet if you select the following:

•Define the first and second formats on one sheet

•Define the format for each page on one sheet


In this case, a page break is inserted as a page separator. However, if you combine the data into one sheet using this method, you will not be able to output the Excel file as a subreport (the output itself will be performed, but the correct results will not be output). If you are sure that you will not be outputting a Excel file, there is no problem in choosing this method.

If you want to output an Excel file as a subreport, be sure to select one of the following and define each format on a separate sheet.

•Define the first and second formats on separate sheets

•Define the format for each page on a separate sheet


▪Print Date Format
The date format used for printing. By default, it prints "xxxx year xx month xx day".


■ Printing


c_action_0069


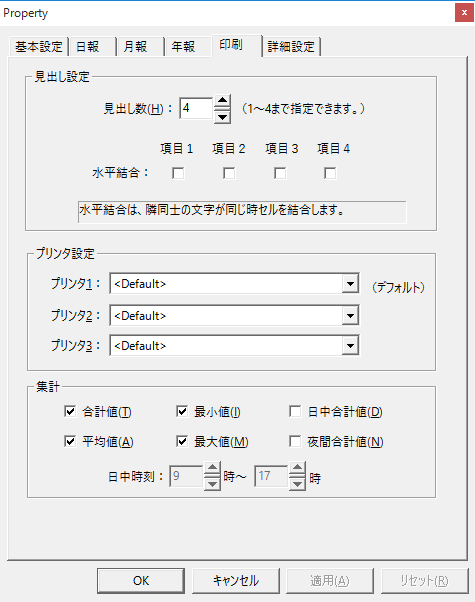
▪Number of Headings
The number of lines to display as the heading. The content to be output in the heading is specified in the field settings.
 

▪Horizontal coupling
Check the items (headings) you want to merge horizontally. If adjacent headings have the same characters, the cells will be merged.
 

▪Printer Settings
Select the printer to print to. If you do not specify anything, the output will be sent to the default printer.
 

▪totalling
Check the items you want to calculate. Items checked here will always be printed. In addition, calculation settings can also be made in the individual settings for each field. If you check calculation here but set the field side to not calculate, the calculation column (cell) for that field will be printed as blank.


Report Field Specifications

Common Settings

■ Basic settings


c_action_0070


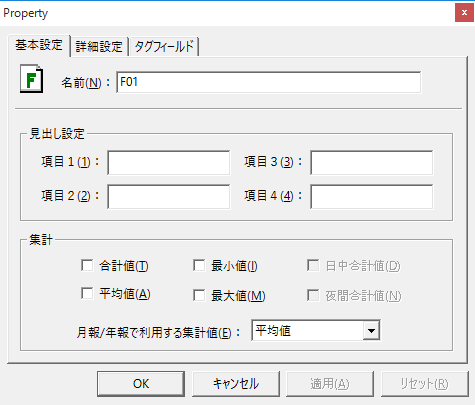
▪Heading Settings
heading (comma "," is not allowed in heading).
 

▪totalling
Select the aggregation item for each field.
 

▪Aggregated values used in monthly and annual reports
Aggregation value used when expanding into monthly and annual reports.


■ Advanced settings


c_action_0071


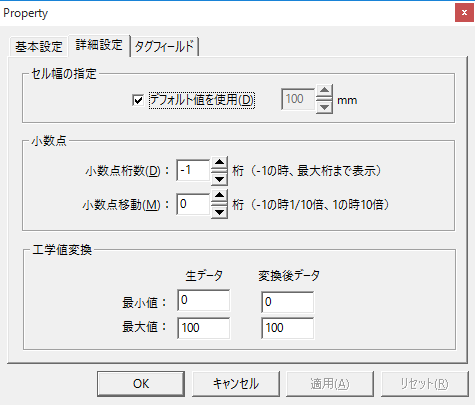
▪Specifying the cell width
If you want to set the cell width for each field when the daily report is displayed on the screen, uncheck "Use default value" and set the width.
 

▪Decimal Point
The number of digits in the data can be changed by changing the number of decimal places and moving the decimal point. The total, average, maximum, and minimum values are calculated based on the values after these processes are performed.
 
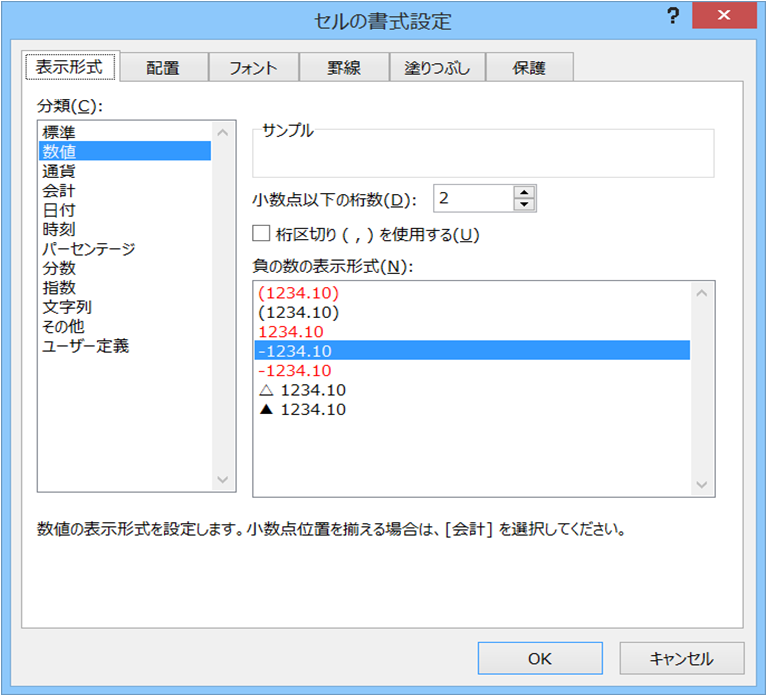
The number of digits displayed when actually printing will depend on the cell format in Excel. In the template layout master file "reportmaster.xls", it is set to display two decimal places. Select "Format menu" "Cells" to set the format.
c_action_0330


▪Engineering Value Conversion
Please set this if you want to convert the value of the tag to an engineering value.


Tag Field


c_action_0233


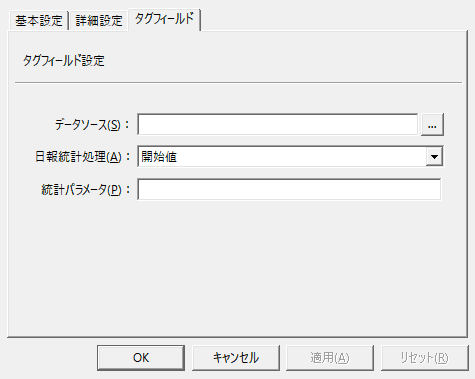
▪Data Source
Enter or select the target data source for the report.
 

▪Daily report statistical processing/statistical parameters
In the tag field, you can select the following methods for processing daily report statistics.


Daily report statistical processing

Statistical parameters

Commentary

Average

none

This is the average value of data within one hour.

If there is a possibility that null values (NULL values) may be stored in the data, specifying "CHECKVALIDVALUE" for the parameter will cause the null values to be ignored.

Sum

none

This is the total value of the data within one hour.

Number of data

none

The number of data points included in one hour.

If there is a possibility that null values (NULL values) may be stored in the data, specifying "CHECKVALIDVALUE" for the parameter will cause the null values to be ignored.

Maximum

none

Find the largest value among the data within an hour.

If there is a possibility that null values (NULL values) may be stored in the data, specifying "CHECKVALIDVALUE" for the parameter will cause the null values to be ignored.

Minimum

none

Find the smallest value among the data within an hour.

If there is a possibility that null values (NULL values) may be stored in the data, specifying "CHECKVALIDVALUE" for the parameter will cause the null values to be ignored.

Start value

none

This is the first hour of data within an hour.

If there is a possibility that null values (NULL values) may be stored in the data, specifying "CHECKVALIDVALUE" for the parameter will cause the null values to be ignored.

Median time value

none

This is the data that is located at the center time within the data for one hour.

If there is a possibility that null values (NULL values) may be stored in the data, specifying "CHECKVALIDVALUE" for the parameter will cause the null values to be ignored.

Final Value

none

This is the last data point within an hour.

If there is a possibility that null values (NULL values) may be stored in the data, specifying "CHECKVALIDVALUE" for the parameter will cause the null values to be ignored.

Start value (data time)

none

(Not used with Daily/Monthly/Yearly Report actions.)

Median time value (data time)

none

(Not used with Daily/Monthly/Yearly Report actions.)

Last value (data time)

none

(Not used with Daily/Monthly/Yearly Report actions.)

Range Value

none

Calculates the range (maximum value - minimum value) within one hour of data.

If there is a possibility that null values (NULL values) may be stored in the data, specifying "CHECKVALIDVALUE" for the parameter will cause the null values to be ignored.

Difference value

none

Calculates the difference value (final value - starting value) within one hour of data.

If there is a possibility that null values (NULL values) may be stored in the data, specifying "CHECKVALIDVALUE" for the parameter will cause the null values to be ignored.

Accumulated time value

Division amount

Calculates the total time that the signal is ON within one hour. The unit is ms. If you want to calculate in seconds, specify "1000" as the division amount. If you want to calculate in minutes, specify "60000". If the value cannot be divisible, a decimal point will be displayed. If you want to adjust the decimal point, specify "Number of decimal points" in the "Advanced" tab of the tag field properties. If you do not specify a division amount, the unit will be ms.

"Accumulated time value" does not support missing values. If you are logging using a logger action, make sure not to save a null value (NULL value) when a communication error occurs.


Accumulated Pulse Value

none

Calculate the number of times it was turned ON within an hour.

If there is a possibility that null values (NULL values) may be stored in the data, specifying "CHECKVALIDVALUE" for the parameter will cause the null values to be ignored.

Accumulation counter value

Boundary value

Specifies the boundary value of the accumulation counter. The maximum value that can be set is 4294967296.


The cumulative counter value is used to calculate the amount of change in value per hour using a ring counter. In many cases, it is used to calculate the cumulative value as a result (only integers can be used as ring counter values, decimals cannot be used). A ring counter is a counter that resets to 0 again when it reaches a certain value (boundary value). For example, if the boundary value is 1000, the value increases from 0 to 999 and then returns to 0 again (repeating from 0 to 999).


For example, if you want to find the flow rate or power consumption per hour, create a ring counter on the PLC side and increment the counter value as needed according to the flow rate or power consumption (including a process to increment the counter from 0 again when it reaches a boundary value). By performing this statistical processing, the actual flow rate or power consumption per hour can be automatically calculated from the ring counter value.


For an accumulating counter, you must set a boundary value in the statistical parameters. For example, for a ring counter that ranges from 0 to 99, set the boundary value to 100 (i.e. the maximum value of 99 + 1).


Also, the "accumulated counter value" does not support missing values. If you are logging using a logger action, make sure not to save a null value (NULL value) when a communication error occurs.


Example 1) When the boundary value is 100 (0 to 99)

data

"2004/01/01 00:00:00", "20"

"2004/01/01 00:20:00"," 49"

"2004/01/01 00:40:07", "70"

"2004/01/01 01:00:00"," 87"

"2004/01/01 01:20:00"," 20"

"2004/01/01 01:40:00", "45"


Result

"2004/01/01 00:00", "50"

"2004/01/01 01:00", "75"


Example 2) When data is missing (boundary value is 100)

data

"2004/01/01 00:00:01", "20"

"2004/01/01 01:00:01"," 87"

"2004/01/01 03:00:01"," 20" ← Data from 2 o'clock is missing


Result

"2004/01/01 01:00", "67"

"2004/01/01 02:00", "" ← The count results for 2 o'clock will be empty

"2004/01/01 03:00", "33" ← Calculated using the data at 1 o'clock as the final value


attention

Start value (characters) and end value (characters) are not supported and should not be used.


Calculated Fields


c_action_0072


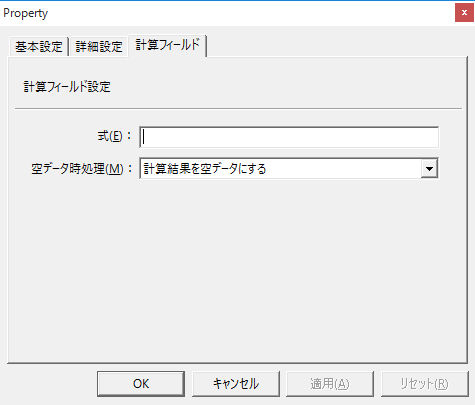
▪formula
Calculates fields together.
Example: F01+F02
You can use operators that can be used in SC1 syntax.


▪Processing when data is empty
This is the calculation method to use when there is no value in the source field.
 

Constant Fields


c_action_0073


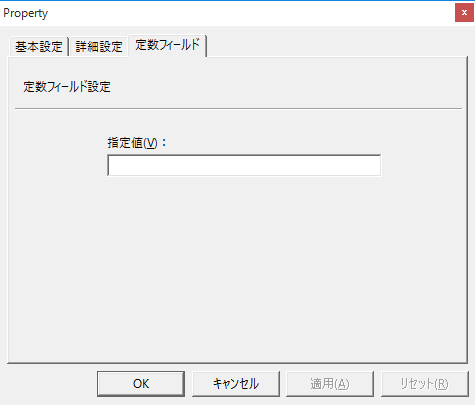
▪Specified value
The value set in the specified value is stored.
If nothing is specified, it will be empty (nothing will be displayed).