Scatter plot graph screen explanation
# |
name |
explanation |
|---|---|---|
1 |
Pen Name |
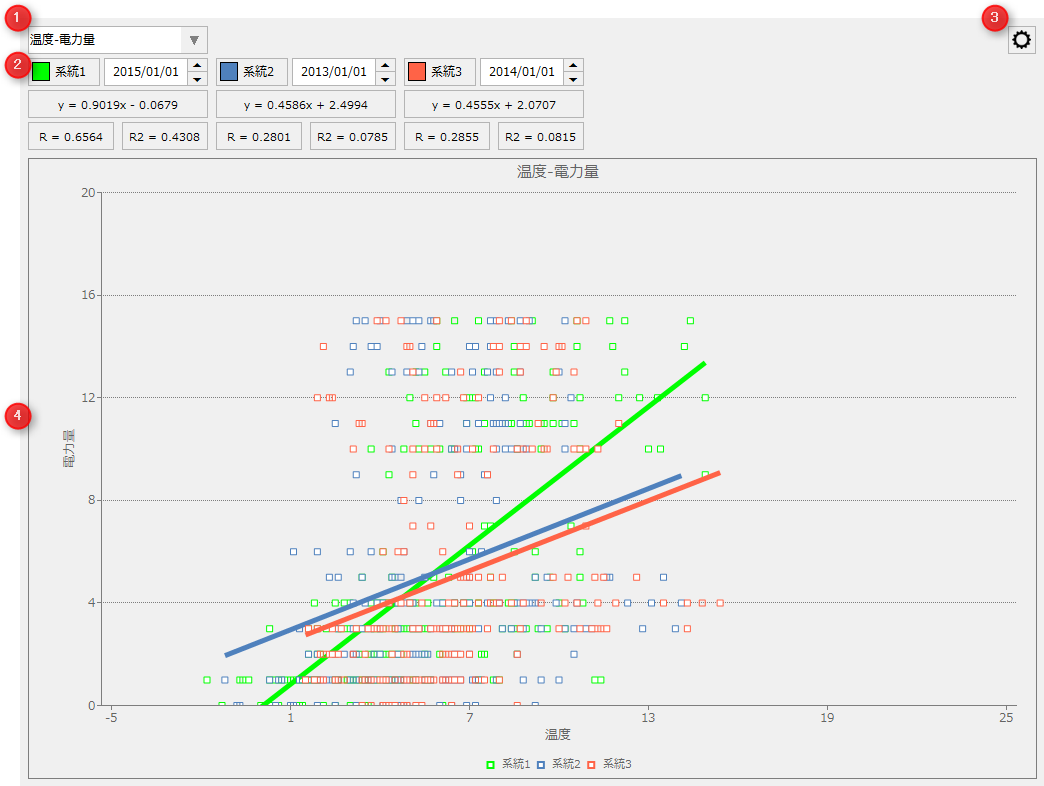
Select the pen you want to display as active.
|
2 |
system |
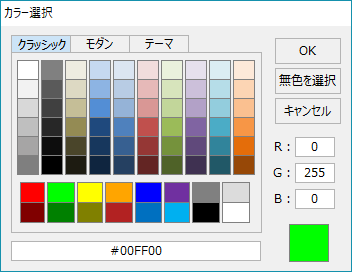
The following information is displayed in three time series: •Color (plot color and regression line color) •date •Regression equation •Correlation coefficient R, coefficient of determination R2 |
3 |
Settings Menu |
Opens the settings menu. Each time you click the icon, the settings menu will be displayed/hidden. For information on the settings menu, please refer to "Settings Menu".
|
4 |
Scatter Plot Graph |
Displays a scatter plot graph. |