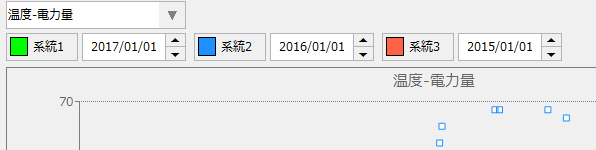
Scatter Plot Graph Settings Menu
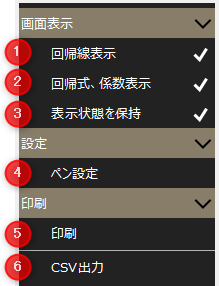
# |
name |
explanation |
|---|---|---|
1 |
Regression Line Display |
Toggles the display of the regression line on the scatter plot graph. If checked, the regression line will be displayed, if unchecked, the regression line will not be displayed.
|
2 |
Regression equation, coefficient display |
Regression equation, correlation coefficient R, and coefficient of determination R for each lineage2When checked, it is displayed, when unchecked, it is hidden.
(Example of hidden content) |
3 |
Maintain Visibility |
The settings changed on the screen will be retained. Note that the settings are saved for each client.
|
4 |
Pen Settings |
|
5 |
printing |
Print the scatter plot graph.
|
6 |
CSV Output |
The display data for each system is output to a CSV file.
|