Scatter plot graph settings screen
Pen settings screen
This is the settings screen for registering a pen.
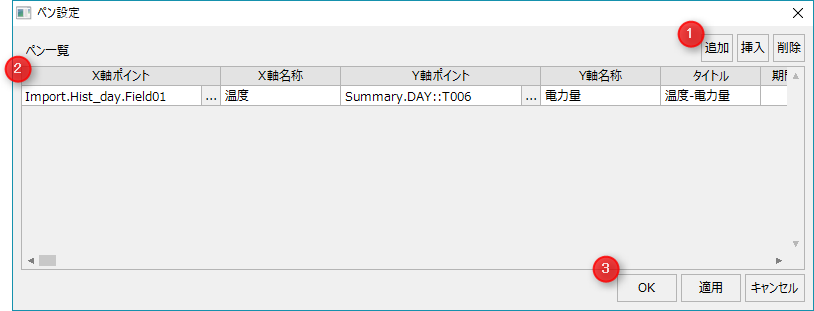
# |
name |
explanation |
||||||
|---|---|---|---|---|---|---|---|---|
1 |
Pen operation |
|
||||||
2 |
X-Axis Points |
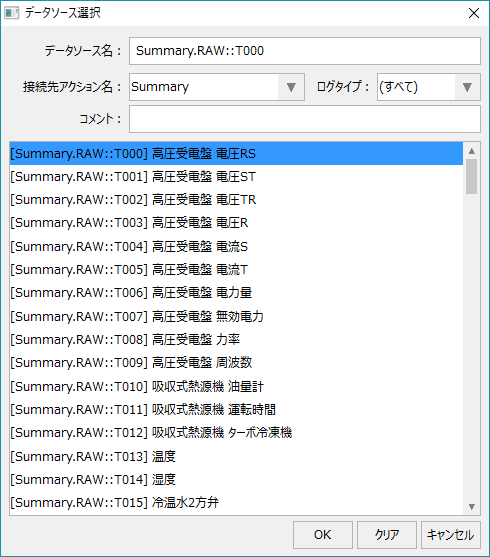
Specify the data source for the X-axis (horizontal axis). Press the button to open the data source setting.
|
||||||
3 |
X-axis name |
Enter the name of the X-axis (horizontal axis).
|
||||||
4 |
Y-axis points |
Specify the data source for the Y-axis (vertical axis). Press the button to open the data source setting.
|
||||||
5 |
Y-axis name |
Enter the name of the Y-axis (vertical axis).
|
||||||
6 |
title |
Enter a title.
|
||||||
7 |
Period specification |
Specify the number of days from the date of each system to retrieve data. Of the data for the number of days specified here, the target data for the scatter plot will be retrieved with the "_DataMax" custom property value as the upper limit.
|
||||||
8 |
X-axis units |
Enter the unit for the X-axis (horizontal axis).
|
||||||
9 |
X-axis decimal point |
Enter the number of decimal points for the X-axis (horizontal axis).
|
||||||
10 |
X-axis lower limit |
Enter the lower limit of the X-axis (horizontal axis). If the acquired data is smaller than this lower limit, the minimum value of the acquired data will become the lower limit.
|
||||||
11 |
X-axis upper limit |
Enter the upper limit for the X-axis (horizontal axis). If the acquired data exceeds this upper limit, the maximum value of the acquired data will become the upper limit.
|
||||||
12 |
Y-axis units |
Enter the unit for the Y-axis (vertical axis).
|
||||||
13 |
Y-axis decimal point |
Enter the number of decimal places for the Y-axis (vertical axis).
|
||||||
14 |
Y-axis lower limit |
Enter the lower limit of the Y-axis (vertical axis). If the acquired data is smaller than this lower limit, the minimum value of the acquired data will become the lower limit.
|
||||||
15 |
Y-axis upper limit |
Enter the upper limit value for the Y axis (vertical axis). If the acquired data exceeds this upper limit, the maximum value of the acquired data will become the upper limit.
|