How demand forecasts are calculated
The method for calculating the slope of the demand monitoring forecast line can be selected from the forecast value calculation method on the Demand detailed settings screen.
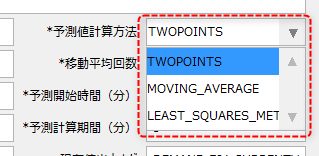
You can choose from the following three calculation methods.
Calculation method |
Contents |
TWOPOINTS |
A straight line (forecast line) is drawn through two points: the current data at the time of calculation and the most recent data separated by the time specified in the forecast calculation period (minutes), and the forecast value of demand power at the end of the demand period on the forecast line is calculated.
|
MOVING_AVERAGE |
A straight line (forecast line) is drawn through two points: the current data at the time of calculation and the most recent data separated by the time specified in the forecast calculation period (minutes), and the forecast value of demand power at the end of the demand period on the forecast line is calculated. Then, using the previous data as the base point, a forecast is calculated based on the most recent data separated by the time period specified in the forecast calculation period (minutes). This process is repeated the number of times specified in the "moving average count", and finally the average of these forecast values is calculated (in other words, the results calculated using the two-point calculation method are calculated going back the number of times in the past for the moving average count, and then the average of these is calculated).
|
LEAST_SQUARES_METHOD (Least Squares Method) |
Based on the time series data of demand power within the time range specified by the forecast calculation period (minutes) from the current time of calculation, the increment slope is calculated using the least squares method, a straight line (forecast line) passing through the most recent demand power value is drawn, and the forecast value of demand power at the end of the demand period on the forecast line is calculated.
|
|
In all of the above table calculation methods, the calculation of the forecast value begins after the time specified in "Forecast start time (min)" has elapsed. The demand power forecast line will be displayed after the calculation starts.
|
