overview
This section explains how to manually import the Panel Server side settings from the sample of the demand history screen library.
In addition, for projects generated using the standard framework, the settings for demand actions (Demand) and demand history summary actions (DemandSummary) are usually pre-built in, so there is no need to import each setting manually.
The steps introduced here should be performed in the following cases:
•For your own projects that do not use standard frameworks.
•When the standard framework is used, but the required action or event settings have been deleted (for example, when adding a demand monitoring function after implementation).
|
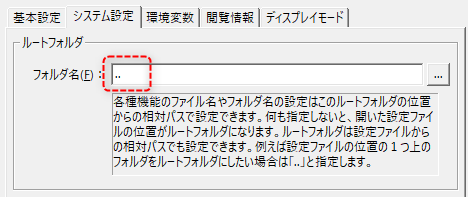
The steps introduced on this page assume that the root folder of the Panel Server application settings/system settings is set as follows. Also, when importing actions from a sample, the settings for each action are set with a relative path. This setting allows the project to continue working even if the folder name or folder hierarchy of the project folder changes. If you do not specify a root folder, such as when importing a screen library into your own project, make adjustments according to the project environment, such as making sure the relative path reference locations match, or defining the reference destination of each file with an absolute path. For details, see "System Settings" in the Panel Server application settings.
(system settings root folder)
|

Manually importing server settings
Below are the steps to manually import the Panel Server side settings from the screen library sample.
■ Work procedure
1.Open Panel Server
With the project you are currently working on open, right-click "server.txt" in the Panel Editor tree to display the menu, and select "Open Server" from the menu.
This will start Panel Server with the target server configuration file open.
2.Open the Screen Library sample
Select the Library tab of the Panel Editor you are currently working on, and select the "Demand History" thumbnail from the screen library.
When you select a thumbnail, a description of the screen library's functions will be displayed, so click the "Sample" button at the bottom.
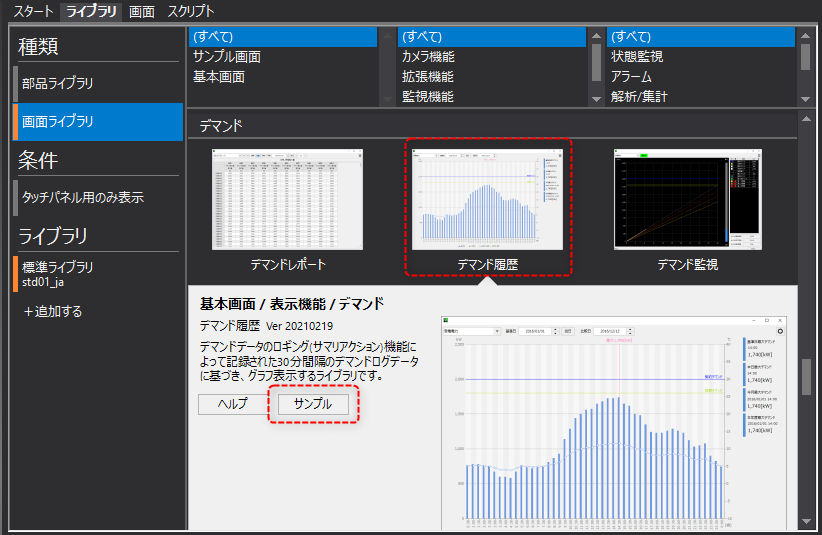
This will start a new Panel Editor separate from the Panel Editor you are currently using, with the sample project open.
3.Open the sample project's server configuration file in edit mode
Right-click on "server.txt" in the left tree of the newly opened Panel Editor to display the menu and select "Open Server (Edit Mode)."
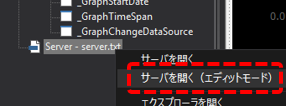
This will start a new Panel Server in edit mode with the sample server configuration file open.
|
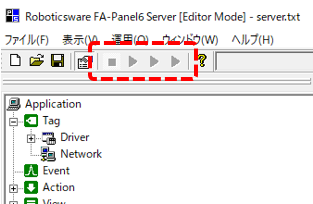
In edit mode on Panel Server, the various icons for online operations are in a dim state as shown on the left, and online operation cannot be performed.
By opening a sample server configuration file in this mode, you can copy settings such as actions and events between Panel Server.
|
|
Panel Server cannot be started multiple times at the same time in normal mode. You can start another one only if you open it in edit mode. |
4.Capture demand history actions from samples
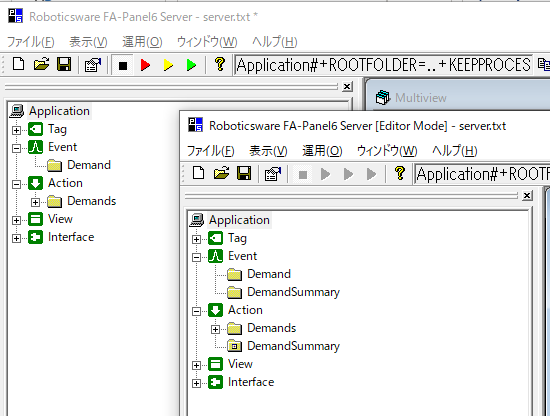
First, arrange the windows so that both the Panel Server you are currently working on and the Panel Server with the sample open in edit mode are visible, as shown in the image below.
If demand monitoring is already installed, the "Demand" folder will be registered in the events and the "Demands" folder will be registered in the actions, as shown below.
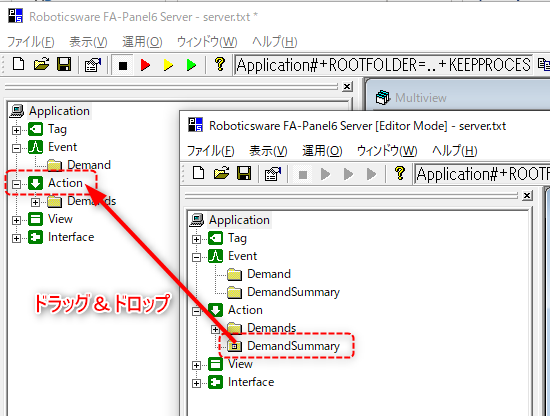
In this state, drag and drop the "DemandSummary" action registered under Action of the sample Panel Server onto the "Action" of the Panel Server you are currently working on, along with the folder.
If the project you are currently working on already has a "DemandSummary" action, there is no need to import the action from the sample.
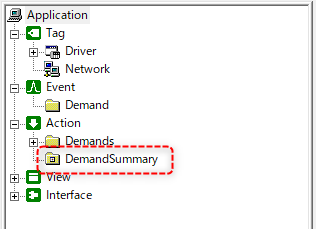
The "DemandSummary" action was then copied under Action on the Panel Server side you were currently working on.
5.Capture historical demand events from a sample
Next, configure events for demand history as necessary.
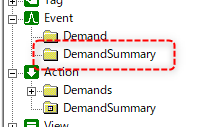
Drag and drop the "DemandSummary" event folder registered under Event of the sample Panel Server onto "Event" of the Panel Server you are currently working on.
If the project you are currently working on already has a "DemandSummary" event folder, there is no need to import events from the sample.
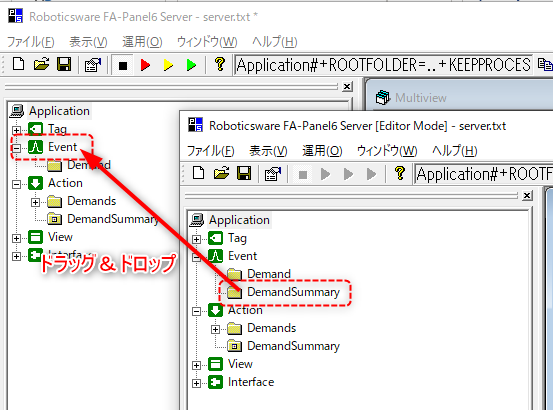
The "DemandSummary" event folder was then copied under Event on the Panel Server side you were currently working on.
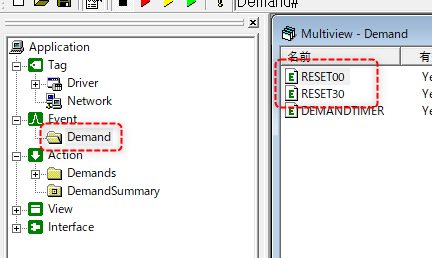
The demand history screen library is intended to be used in conjunction with the demand monitoring screen library. If demand monitoring is already installed, a folder called "Demand" is registered in the events, and events called "RESET00" and "RESET30" are registered. If these events are not registered, please install the demand monitoring screen library first.
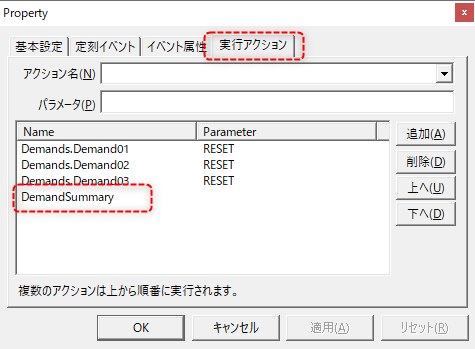
Open the properties of RESET00 and RESET30 above and confirm that "DemandSummary" is registered as the execution action.If you're already registered, you don't need to change any settings for your event.
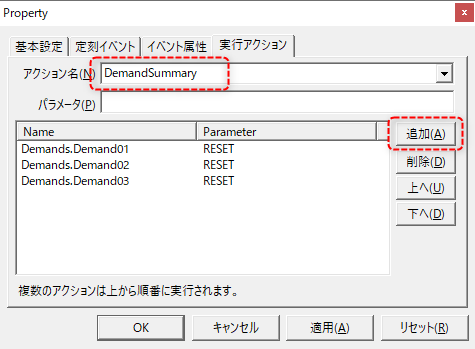
If the RESET00 and RESET30 events do not have the "DemandSummary" action called, add "DemandSummary" to the execution action of each event.
Additional steps:
1)View the properties of an event.
2)Open the Run Actions tab.
3)Select "DemandSummary" from the action name combo box and click the "Add" button.
6.Get the required tags from the sample
Next, copy the tag definitions required for demand monitoring from the sample project.If these tags have already been registered, there is no need to import them.
Click "Driver" on the sample Panel Server side to open it and display the "Demand" unit in the tree. This unit registers tags used for demand monitoring, demand history, and demand report aggregation.
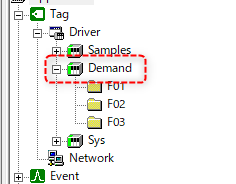
Similar to the procedure for importing the action, drag and drop the "Demand" unit registered in the Driver of the sample Panel Server onto the "Driver" of the Panel Server you are currently working on.
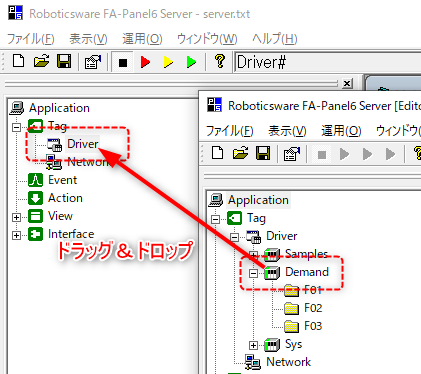
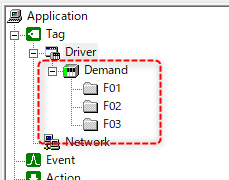
The "Demand" unit was then copied to the Panel Server tag you were currently working on.
7.Import the necessary folders from the sample
Next, copy the necessary files and folders from the sample project. In the Panel Editor where the sample project is open, right-click "server.txt" in the tree on the left to display the menu, and select "Open Explorer".
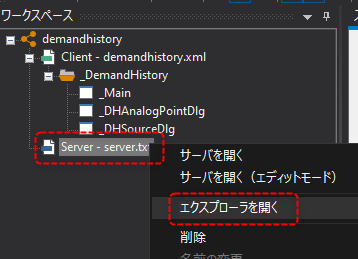
This will launch Explorer with the location where the sample server configuration file is stored.
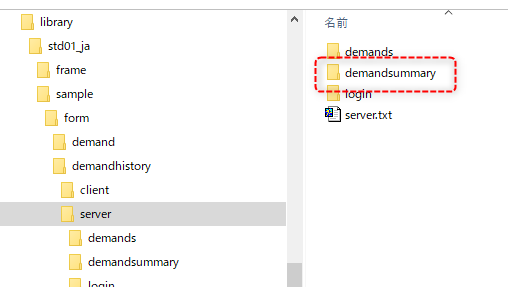
Here, the folder that needs to be imported is the "demandsummary" folder under the server folder of the sample project.
From Explorer,Copy the entire “demandsummary” folder into the server folder in the project folder you are currently working on.
If the "demandsummary" folder already exists, there is no need to import the folder from the sample.
8.Set up the public folder for Panel-Interface
Next, go to the Panel Server's Panel-Interface settings and set up the public folder required for this screen library.If the necessary public folders are already registered, there is no need to configure this.
In the left tree of the Panel Server you are currently working on, right-click on Interface "Panel" and display its properties.
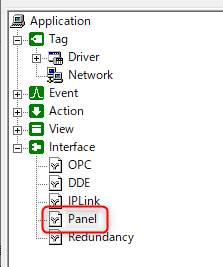
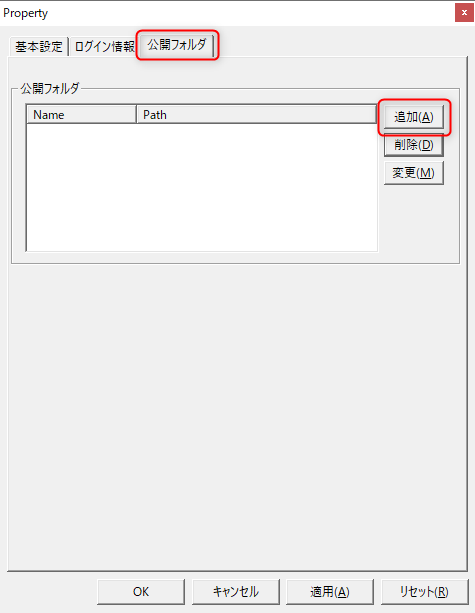
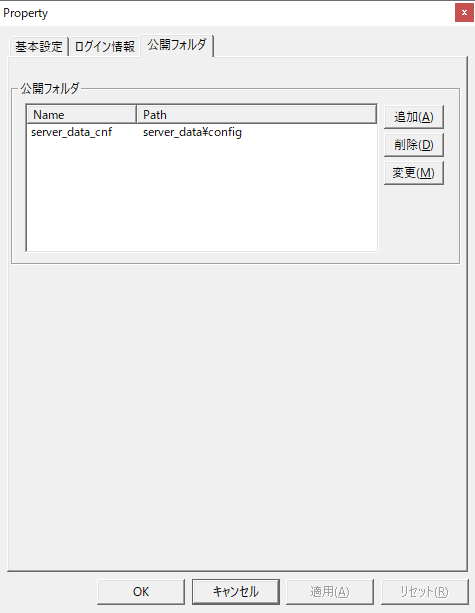
Select the "Public Folders" tab in the Properties dialog and click the "Add" button.
On the public folder settings screen, enter the following information and click the OK button.
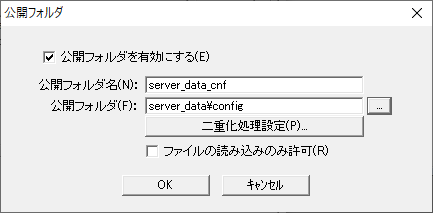
•Enable public folder: Check
•Public Folder Name: server_data_cnf
•Public folder: server_data\config
•Allow file reading only: Uncheck
Verify that the contents you added are reflected in the public folder list, and then click the OK button in the Properties dialog to save the settings.
This completes the import of the necessary setting files.
For details on how to configure the imported files and other subsequent setup procedures, please refer to the individual contents described in "Demand monitoring setup for a standard project".