overview
The standard trend graph screen is built using "Histrical data graph control".
Histrical data graph control is a standard control that can be attached to a form to customize it however you like.
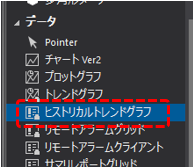
Here we will explain how to paste Histrical data graph control into a form and display log data as a unique trend graph.
(Example)
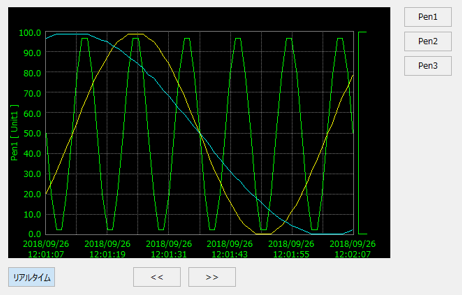
Download the sample
The creation examples shown on this page are provided with samples.
The sample can be downloaded from below.
Procedure
■ Prerequisites
In the steps introduced below, we will paste Histrical data graph control into the "Form01" form and create it.
In addition, in the example project, eight tags, U01.F01.SD0008 to U01.F01.SD0015, have been registered as SD tags for the virtual device, and the summary action "Summary" has been set up so that logging will be performed with consecutive field names, "T001" to "T008".
Virtual device unit: U01
Folder: F01
Tags: 8 special device tags from SD0008 to SD0015
Summary action: Summary
In addition, in the sample introduced here, the Form01 form has been implemented so that it can be called up as "Sample Graphic 1" from the left menu of the standard framework.
■ Implementation of Histrical data graph control
1.Select the target form
From Panel Editor, open the form where you want to paste Histrical data graph control.
In this example, we will use the "Form01" form.
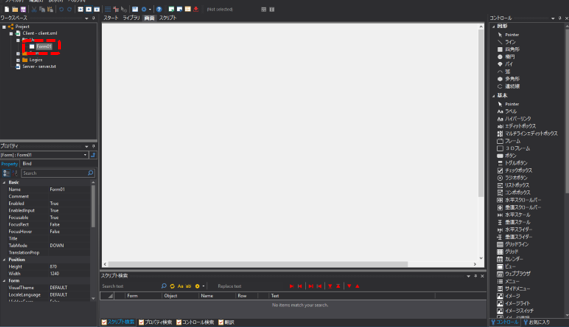
Currently, this form is blank and has nothing in it.
2.Paste Histrical data graph control
|
From the "Controls" on the right side of the Panel Editor screen, select "Historical Trend Graph" and paste it anywhere on the Form01 form.
|
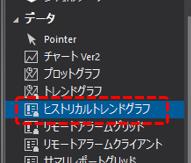
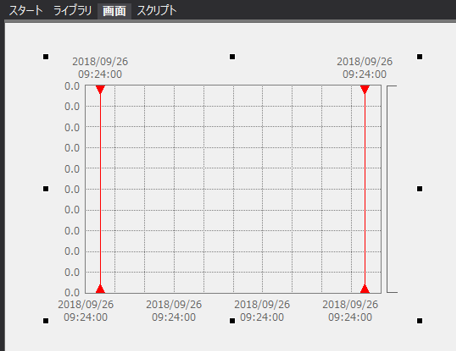
Here is what it looks like pasted onto the form:
3.Set the Histrical data graph control property
Double-click on any of the above controls to display the properties dialog and configure it.
The following is an example of settings. You can freely change the display colors, etc.
|
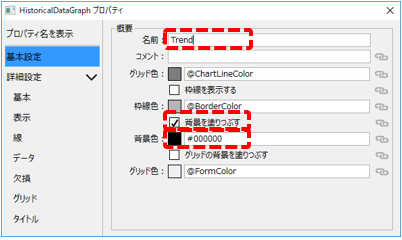
Select Basic Settings and configure the following:
•Name: Trend *Please use half-width characters •Background color: #000000 (black) •Check Fill background
You can give it any name, but here we will use the name "Trend" as an example. |
|
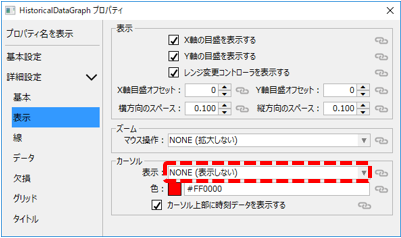
Select Display and set the following:
•Cursor: NONE (not displayed)
|
4.Write a script for Histrical data graph control
To display log data in Histrical data graph control, you need to write a script.
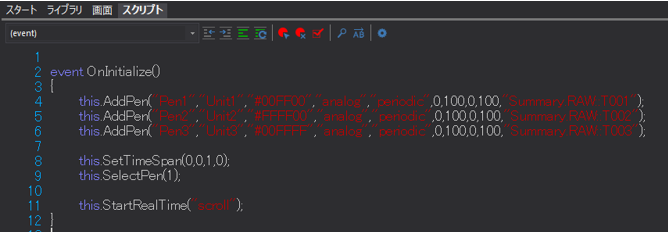
Please write the script referring to the following (the details of the processing will be explained later).
(Script example for Histrical data graph control)
event OnInitialize() { this.AddPen("Pen1","Unit1","#00FF00","analog","periodic",0,100,0,100,"Summary.RAW::T001"); this.AddPen("Pen2","Unit2","#FFFF00","analog","periodic",0,100,0,100,"Summary.RAW::T002"); this.AddPen("Pen3","Unit3","#00FFFF","analog","periodic",0,100,0,100,"Summary.RAW::T003");
this.SetTimeSpan(0,0,1,0); this.SelectPen(1);
this.StartRealTime("scroll"); } |
In the above, the OnInitialize event is written with the process for displaying a trend graph. Here, three pens are added as an example. In addition, each pen is written to reference "T001", "T002", and "T003" that are pre-registered in the summary action "Summary" as data sources.
(Script page example)
■ Implementing graph operation buttons
Next, create buttons for various operations on the trend graph.
1.Implementing the pen selection button
Place three Button control near the right of Histrical data graph control as shown below, and set Text to "Pen1", "Pen2", and "Pen3".
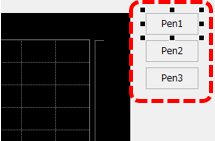
Write the following script in the OnMouseUp event of each button.
(Pen1 button script example)
event OnMouseUp(button) { parent.Trend.SelectPen(1); } |
(Pen2 button script example)
event OnMouseUp(button) { parent.Trend.SelectPen(2); } |
(Pen3 button script example)
event OnMouseUp(button) { parent.Trend.SelectPen(3); } |
2.Real-time display switching button implementation
Place Toggle button control near the bottom left of Histrical data graph control as shown below, and set Text to "Real-time".
Here, set the SwitchValue property of the toggle button to "True".
Next, write the following script in the OnSwitchChanged event of the toggle button.
(Real-time button script example)
event OnSwitchChanged(value) { if(value) { parent.Trend.StartRealTime("scroll"); } else { parent.Trend.StopRealTime(); } } |
The above process will allow you to switch the trend graph to real-time display (automatic scrolling) each time you click the button.
3.Implementing page switching buttons
Next, create buttons to switch pages on the trend graph.
Place two Button control elements near the bottom of Histrical data graph control as shown below, and set Text to "<<" and ">>".
Write the following script in the OnMouseUp event of each button.
(Back button (<<) script example)
event OnMouseUp(button) { parent.Trend.Scroll("backward_half"); } |
(Script example for forward button (>>))
event OnMouseUp(button) { parent.Trend.Scroll("forward_half"); } |
Operation check
Now let's check how it works.
Click Online (yellow arrow) at the top of the Panel Server screen.
Next, click on the browser run icon (green arrow) at the top of the Panel Editor screen to call up Panel Browser.
Once Panel Browser is launched, display the form in which you just implemented the trend graph screen.
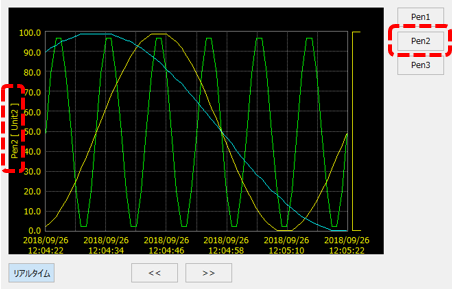
Make sure that three pens are displayed on the Histrical data graph control you placed on the screen and that the graph is updating in real time.
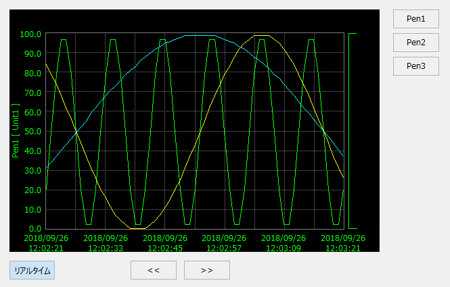
Clicking the pen selection button will switch to the target pen, and the X-axis and Y-axis display will change accordingly.
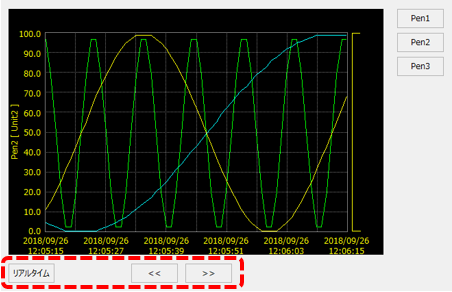
Clicking the Real-time button will stop real-time updates. When updates are stopped, you can click the forward (<<) and back (>>) buttons to scroll the graph by half a page.
supplementary explanation
■Script for Histrical data graph control
In the Histrical data graph control script, the following processing was written in the OnInitialize event.
The OnInitialize event is executed only once during initialization.
event OnInitialize() { this.AddPen("Pen1","Unit1","#00FF00","analog","periodic",0,100,0,100,"Summary.RAW::T001"); this.AddPen("Pen2","Unit2","#FFFF00","analog","periodic",0,100,0,100,"Summary.RAW::T002"); this.AddPen("Pen3","Unit3","#00FFFF","analog","periodic",0,100,0,100,"Summary.RAW::T003");
this.SetTimeSpan(0,0,1,0); this.SelectPen(1);
this.StartRealTime("scroll"); } |
AddPen Method
First, the pen is added using the AddPen method.
this.AddPen("Pen1","Unit1","#00FF00","analog","periodic",0,100,0,100,"Summary.RAW::T001");
The arguments passed to the AddPen method are, from the top, the title, unit, display color (in RGB format), type of data to display, graph plot type, minimum data value, maximum data value, lower limit of the data display range (%), upper limit of the data display range (%), and data source name.
The data type can be "boolean" (bit), "analog" (numeric value), or "enumeration" (integer). In this example, we have specified analog to display numeric values.
The plot type is set to "periodic" and is displayed as a line graph. You can also set the plot type to a stepped display like pulse data or a bar graph display.
The data display range can be specified by setting the lower limit of the graph's vertical axis to 0% and the upper limit to 100%, and specifying the graph area to be used for display as a percentage. For example, if you set the lower limit to 0 and the upper limit to 20, the graph will be displayed using the lower 20% of the graph area.
Also, for the data source, specify the name of the Historical data server data source that can be connected to from the trend graph.
Here, we specify a string to reference the data source registered in the summary action.
Summary.RAW::T001
The above is an example of a summary action. In summary actions, the field name is specified as action name.summary name::field name.
|
The format you specify for the data source name depends on the action you want to connect to.
For summary actions, specify the field name in the format action name.summary name::field name.
example) Summary.RAW::T001 - RAW data of T001 field Summary.DAY::T001 - Daily report data for the T001 field
For other actions (logger actions, Historical data server actions, etc.), Specify the action name.field name.
example) A01.T001: T001 field of logger action "A01"
|

SetTimeSpan Method
After executing AddPen, the SetTimeSpan method is used to specify the display period of the graph.
this.SetTimeSpan(0,0,1,0);
In the SetTimeSpan method, specify the display period in days, hours, minutes, and seconds, starting from the first argument. In the above example, it is 0 days, 0 hours, 1 minute, and 0 seconds, which means the display period is 1 minute.
In this example, the display period is specified only once during initialization, but if you change the time span during execution, be sure to call the Refresh method each time after calling this method.
SelectPen Method
The SelectPen method specifies the active pen.
this.SelectPen(1);
The SelectPen method takes a pen number as an argument. Pen numbers are specified in sequential order starting from 1 in the order in which AddPen was performed.
Furthermore, the method written in the OnMouseUp event of the pen selection button is the same SelectPen method as above.
StartRealTime Method
The StartRealTime method displays real-time trends.
this.StartRealTime("scroll");
You can specify the scroll mode as an argument to the StartRealTime method. Normally, by specifying “scroll” as shown above, the rightmost part of the graph will be the most recent and the graph will scroll to the left.
■ Real-time button script
In the real-time button script, the following processing is written in the OnSwitchValueChanged event.
event OnSwitchChanged(value) { if(value) { parent.Trend.StartRealTime("scroll"); } else { parent.Trend.StopRealTime(); } } |
With toggle buttons, the value of SwitchValue alternates between True and False each time the button is clicked. The above event occurs each time this value changes, and you can receive the value via value.
In the above, when value is True, the StartRealTime method is called to start real-time updates, and when the value is any other way (i.e. False), the StopRealTime method is called to stop scrolling.
■ Script for forward (<<)/back (>>) buttons
The Scroll method is called from the OnMouseUp event of these buttons.
parent.Trend.Scroll("backward_half");
The Scroll method allows you to specify the operation mode as an argument. The modes used here are "backward_half" (go back half a page) and "forward_half" (go forward half a page), but other modes such as "forward" (go back one page), "backward" (go forward one page), and "now" (use the right end as the current time) can also be specified.