overview
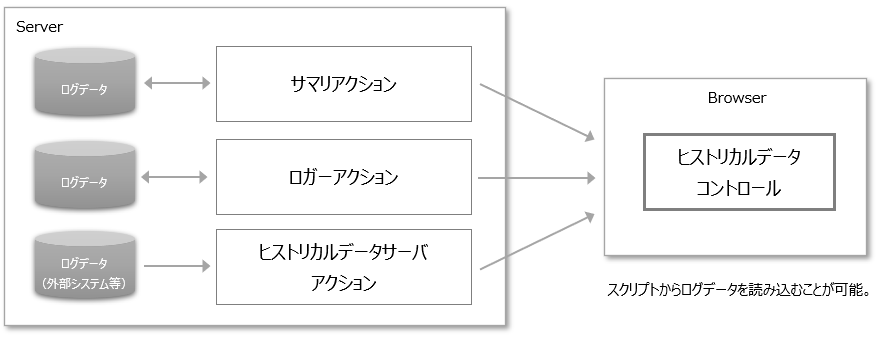
Here we will explain how to use log data by "Historical data control".
Using Historical data control, you can connect to the target action from a script and retrieve log data by specifying search conditions (for example, the data source to retrieve, the date and time range, the maximum number of items, etc.). The retrieved log data can be displayed in a grid or chart, or used for your own aggregation and calculation processing.
Download the sample
The creation examples shown on this page are provided with samples.
The sample can be downloaded from below.
The above sample project implements the following sample screen.
(Sample screen image)
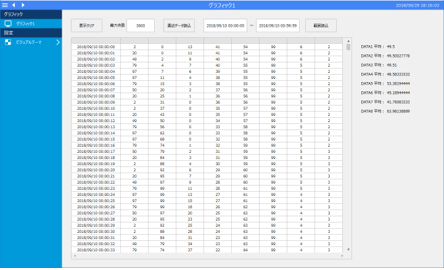
In this sample screen, log data is obtained using Historical data control and displayed in Grid control in the center of the screen, and the average value of the log data for each obtained field is calculated and displayed in a label on the right side of the screen.
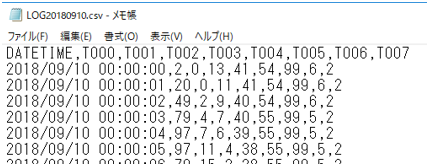
Additionally, a Historical data server (CSV) action is already registered as "A01" in the server-side settings. This Historical data server is configured to map the CSV file included in the sample, and fields from "DATA1" to "DATA8" are defined after the time field "F01".
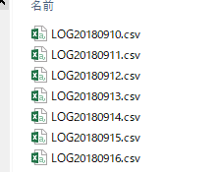
The CSV files included in this sample are as follows:
(Project Folder)\server_data\import)
(Image of CSV file)
Check the sample operation
Now, let's actually run the sample.
Click Online (yellow arrow) at the top of the Panel Server screen.
After starting Panel Server, run Panel Browser to display the sample screen.
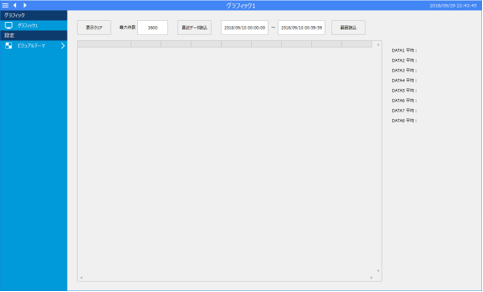
First, try clicking the "Load Range" button on the top right of the screen.

The target log data was then displayed in a grid, with the average values for each column displayed in labels on the right side of the screen.
In addition, the data displayed in the grid is within the date and time range specified in the display range edit box.
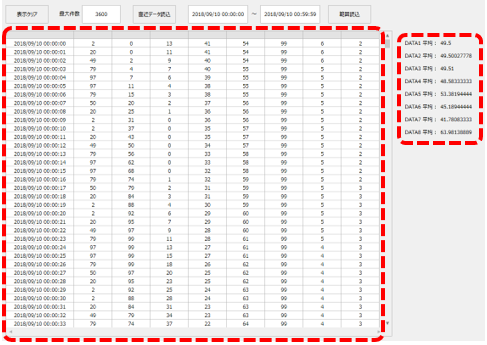
Next, change the "Maximum number of items" to 10 and click the "Load latest data" button.

Now, only the most recent 10 log data items are displayed on the grid.
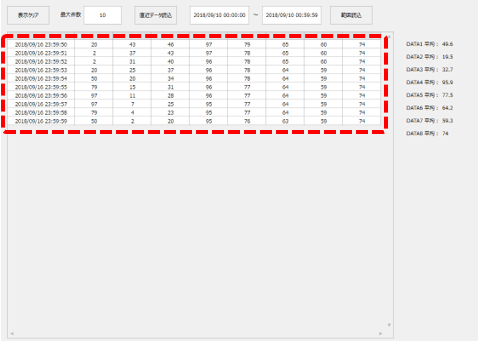
Next, leave the "Maximum number" at 10, change the date range to one hour, to "2018/9/12 05:00:00" and "2018/9/12 05:59:59", and click the "Load range" button.

The log data displayed on the grid will now only show the top 10 items within the period specified in the display range.
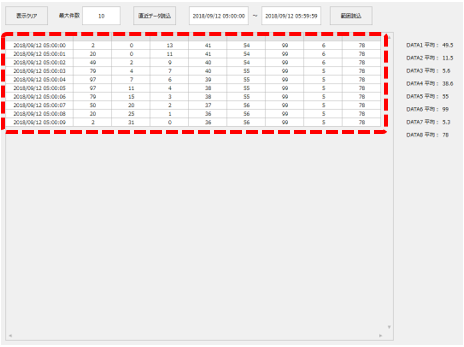
Next, leave the date range the same but change the maximum number of items to 3600, then click the "Load Range" button.

Then, all data for the hour specified in the display range was displayed on the grid (note: since the log is at 1-second intervals, the maximum number of items per hour is 60 seconds * 60 minutes, which is 3,600 items).
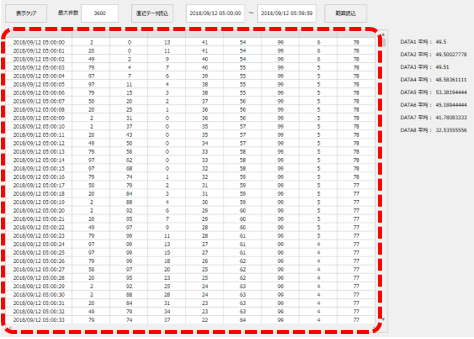
In this way, by using Historical data control, you can retrieve log data from the server and use it on the screen.
Function Description
The main processing contents of the script implemented in the sample are explained below.
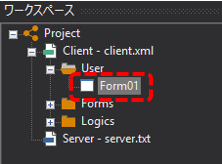
Open the sample project in Panel Editor and select the "Form01" form under the User folder.
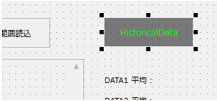
The gray square object with "HistoricalData" displayed in the upper right corner of the form is Historical data control. As you can see, you can see it while editing.
■ Object name (Name property)
Any object you need to reference from a script must have a name in its Name property. Here's the Name property displayed in the mini property box:
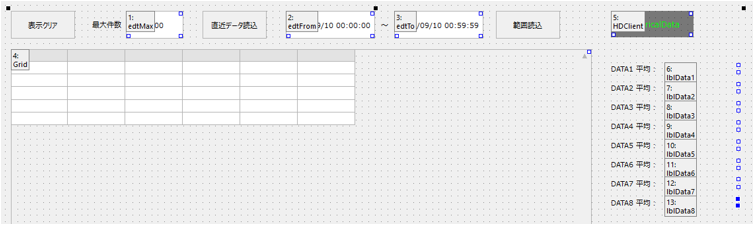
The names of each named object are set as follows:
•Maximum number edit: edtMax
•Date Range (Start) Edit: edtFrom
•Date Range (End) Edit: edtTo
•Historical data control:HDClient
•Grid for displaying data: Grid
•Labels for displaying average values: lblData1 to lblData8
■Script for Historical data control
The following processing is described in the OnInitialize event of Historical data control.
The OnInitialize event is executed only once during initialization.
event OnInitialize() { var vFields = c("A01.DATA1","A01.DATA2","A01.DATA3","A01.DATA4", "A01.DATA5","A01.DATA6","A01.DATA7","A01.DATA8");
this.AddField(vFields);
if (!this.Connect()) { ::OpenMsg("Connection failed"); } } |
First, use the AddField method to specify the field names for which you want to request log data from the server in an array. When specifying the field names, use the format "action name.field name", such as A01.DATA1. After executing AddField, be sure to call the Connect method.
By calling the Connect method, a connection is made to the Historical data server (CSV) action registered on the server side as "A01."
|
For more information about the properties, methods, and events of the Historical data control, see "Historical data control" in the control reference. |

|
When specifying the field name format in Historical data control, for summary actions, specify in the format "action name.summary name::field name", such as A01.RAW::DATA1. For other actions (logger actions, Historical data server actions), specify in the format "action name.field name", such as A01.DATA1. |
■Script for Grid control
The grid describes the following:
event OnInitialize() { this.Cols = 9; this.Rows = 0 ; this.SetColWidth(0, 160); }
function fncRefresh(vDate, vValue) { this.SetTableData(vValue, 1); this.SetColData(0, ::CTimeStr(vDate), FALSE);
parent.lblData1.Text = ::Math.Ave(vValue[0, ]); parent.lblData2.Text = ::Math.Ave(vValue[1, ]); parent.lblData3.Text = ::Math.Ave(vValue[2, ]); parent.lblData4.Text = ::Math.Ave(vValue[3, ]); parent.lblData5.Text = ::Math.Ave(vValue[4, ]); parent.lblData6.Text = ::Math.Ave(vValue[5, ]); parent.lblData7.Text = ::Math.Ave(vValue[6, ]); parent.lblData8.Text = ::Math.Ave(vValue[7, ]); } |
The OnInitialize event initializes the number of columns in the grid display, the display width, and so on.
The user-defined function "fncRefresh" is defined to implement the grid display refresh process. The argument vDate passes the time field values of the log data as a one-dimensional array, and the argument vValue passes the value field values of the log data as a two-dimensional array.
When this user-defined function is called, the SetTableData and SetColData methods are called to populate the grid with log data and display it. The vValue array information is also passed to the Math.Ave method on a column-by-column basis to calculate the average value, and this is assigned to the Text property of the display labels such as lblData1.
Furthermore, the above fncRefresh function is implemented to be called from the scripts of the "Load Latest Data" and "Load Range" buttons.
|
For more information about the properties, methods, and events of the Grid control, see "Grid control" in the control reference. |
■Script for the latest data loading button
This button has the following processing:
event OnMouseUp(button) { var vCount, vDate, vValue;
if (!parent.HDClient.ReadHistoricalData("future", T, "past", T, parent.edtMax.Text, vCount, vDate, vValue)) { ::OpenMsg("Failed to load"); return; }
parent.Grid.fncRefresh(vDate, vValue); } |
The OnMouseUp event of this button requests the reading of log data via Historical data control using the ReadHistoricalData method. The grid and average values are updated by passing the date field (vDate) and log data (vValue) received from Historical data server to the user-defined function "fncRefresh" implemented in the grid and calling it.
The ReadHistoricalData method is a Historical data control method. The argument specifications are as follows:
ReadHistoricalData( |
|
StartTime, |
...The start time of the data you want to retrieve. "future" is the most future date and time. |
bIncludeStartTime, |
...Whether to include start time records (T/F). |
bIncludeStartTime, |
...The end time of the data you want to retrieve. "past" is the oldest date and time. |
bIncludeEndTime, |
...Whether to include end time records (T/F). |
MaxRecord, |
...Maximum record count limit. |
&Count, |
...Maximum record count limit. |
&DateTime, |
...Receive the time field of the retrieved record as a variable. |
&Data |
...Receive the value field of the retrieved record as a variable. |
) |
In the above script, StartTime is fixed to "future" and EndTime is fixed to "past". These are special keywords, and the number of records specified by MaxRecord is retrieved from all periods. Since the search is performed from the future (i.e., the most recent) to the past, the specified number of recent data is retrieved from the latest record of the existing log data.
In the above example, MaxRecord is set to parent.edtMax.Text. This setting means that the value entered in the edtMax text box will be used as the limit for the number of records.
vDateTime is set to the vDate variable, which means that the result of retrieving the time field is stored in vDate.
vData specifies the vValue variable, which stores the result of retrieving the value field in vValue.
■ Script for the range load button
This button has the following processing:
event OnMouseUp(button) { var vCount, vDate, vValue;
if (!parent.HDClient.ReadHistoricalData(parent.edtFrom.Text, T, parent.edtTo.Text, T, parent.edtMax.Text, vCount, vDate, vValue)) { ::OpenMsg("Failed to load"); return; }
parent.Grid.fncRefresh(vDate, vValue); } |
The OnMouseUp event for this button calls the ReadHistoricalData method to request the reading of log data via Historical data control. As with the processing for the Load Most Recent Data button, the results of the log data are passed to the grid's "fncRefresh" to update the grid and average values.
The difference between this button and the Read Latest Data button is that among the arguments passed to the ReadHistoricalData method, parent.edtFrom.Text is specified for StartTime, and parent.edtTo.Text is specified for EndTime. This causes a search to be performed based on the date range specified in the two edit boxes.
In addition, because parent.edtMax.Text is specified for the MaxRecord argument, the value entered in the edtMax text box will be used as the upper limit for the number of records even when searching using a range specification.