overview
This section explains how to manually embed a Scatter Plot Graph from the Screen Library.
If you want to add scatter chart functionality to a standard framework project later, or if you want to build your own project and incorporate a scatter chart, use this procedure as a reference.
|
The screen library comes with samples. You can open the samples from Panel Editor. For details on how to open the samples, please refer to "Screen Library Help / About Samples". |

Manually embedding the scatter plot graph screen library
Below are the steps to manually incorporate the Scatter Plot Chart from the Screens Library.
■ Work procedure
1.Select Screens Library from the Libraries tab
In Panel Editor, select the Library tab and set the type to "Screen Library".
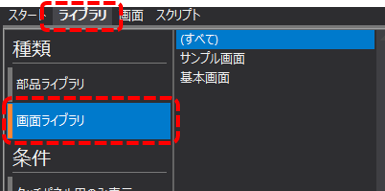
The display in the center of the screen will then switch to the library selection screen.
2.Import "Scatter Plot Graph" from the Screen Library
Select "Scatter Plot Graph" from the screen library list and drag and drop it onto "client.xml" in the project tree.
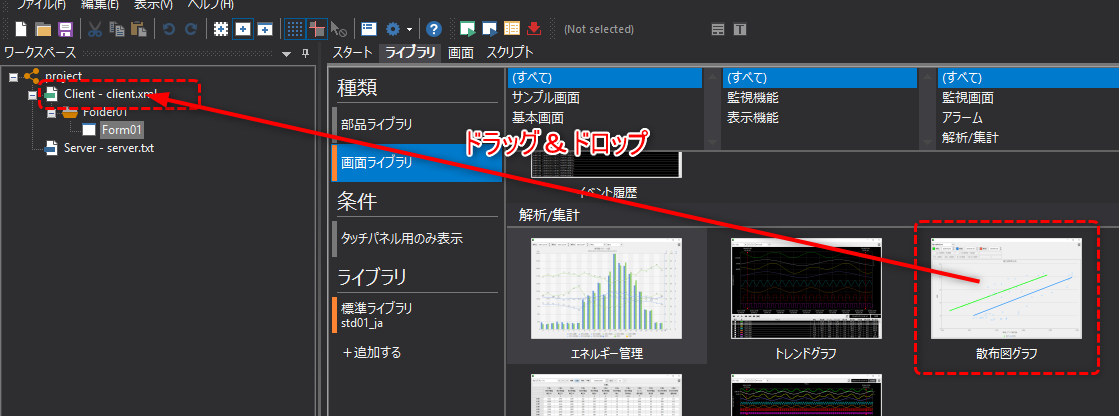
|
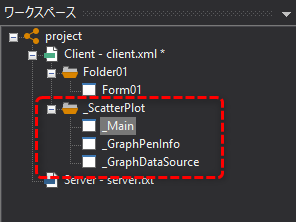
Then, a folder called "_ScatterPlot" was created as shown on the left, and all the forms necessary as a screen library were copied.
_ScatterPlot - Scatter plot graph screen set
|
3.Describe the screen call process
After embedding a form from the screen library, implement the process to call the screen from the library.
There are several ways to call up screens from the Screen Library. For details on how to call up screens, please refer to "Calling Screens from the Screen Library" in the Screen Creation Guide.