overview
The scatter plot graph function is a function for displaying a scatter plot by specifying the data to be analyzed on the X-axis and Y-axis.
In a scatter plot graph, you can freely specify the combination of data to display on the X-axis and Y-axis. For example, by specifying a combination such as outside temperature and power usage, and plotting points at the intersections of each value, you can visually check whether there is a correlation between the data.
(Scatter Plot Graph)
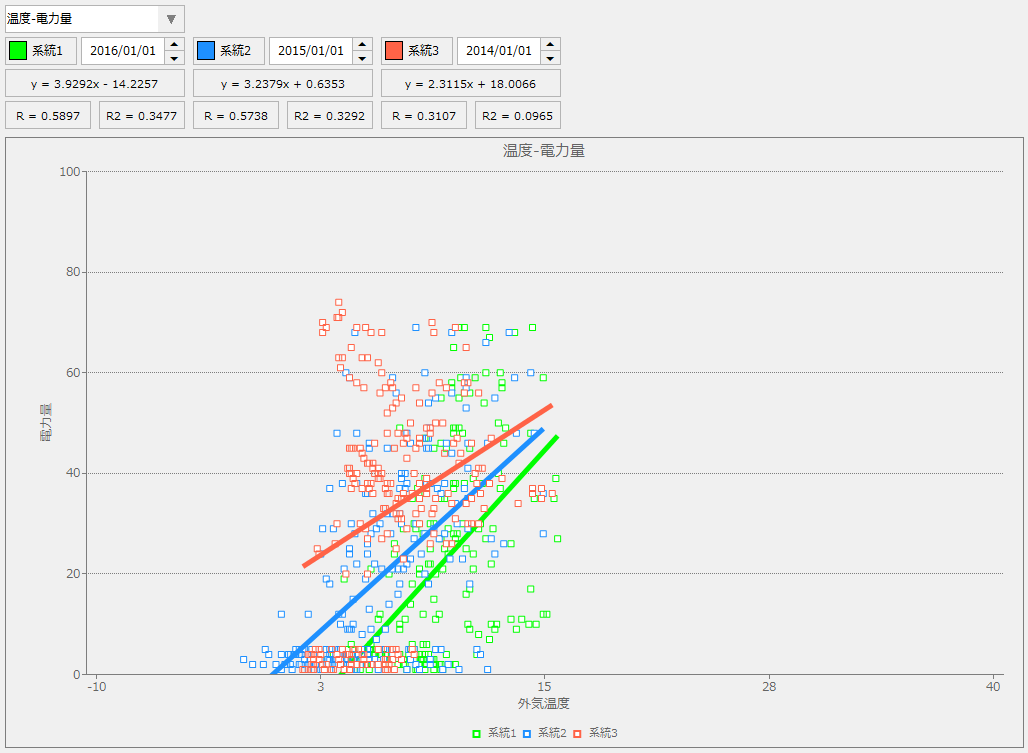
In addition to time-series log data, the data that can be displayed on a scatter plot graph isYou can display aggregated data such as Daily/Monthly/Yearly Report.It is possible to display up to three scatter plots of the same data combinations at the same time, allowing you to compare differences over time. In addition, there is a function to display a regression line on the graph, allowing you to see the slope of the correlation.
Below we explain the basic concept of a scatter plot graph.
content |
overview |
About the Scatter Plot Graph Screen Library
|
A brief explanation of the Scatter Plot Graph Screen Library. |
Relationship between scatter plot graph and server functions
|
This section explains the relationship between the Scatter Plot Graph Screen Library and each action on the server side. |