Relationship between scatter plot graphs and actions
The scatter plot graph function consists of the server function on the Panel Server side and the scatter plot graph screen library on the client side.
The scatter plot graph screen connects to the target action defined in Panel Server, and based on the specified date conditions requested on the screen, retrieves the logging and aggregation data to be displayed (historical data (log data), daily report data, monthly report data, yearly report data) and displays it as a graph.
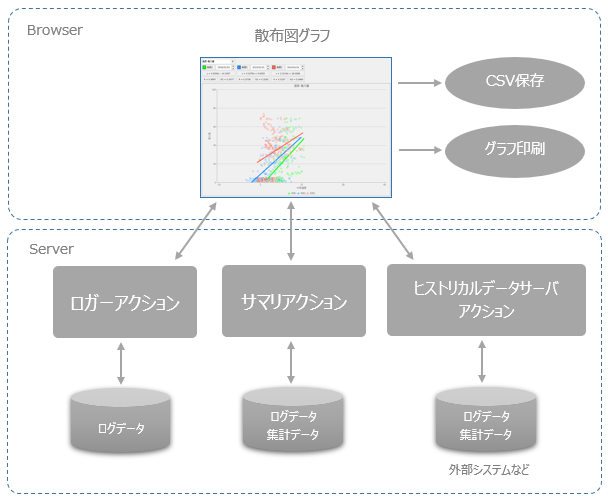
Destination Server Action
The following server functions can be connected from the scatter plot graph function.
kinds |
explanation |
|
|
Summary Action is an action for logging and aggregation that integrates logging, aggregation, and reporting functions. The scatter plot graph screen can be connected to a summary action to obtain and display log data and aggregated data in Daily/Monthly/Yearly Report units.
|
|
|
This is an action that allows simple logging. It can be specified as a data source for a scatter plot graph. |
|
|
This action maps time-series log data generated by external systems as a data source. It can be specified as a data source for a scatter plot graph.
|
The above action is available in two types, CSV and ODBC, and you can connect to either type.
For information on the types of DBMS that can be connected, please refer to "About supported databases".