Scatter Plot Graph Screen Operations
This section explains the basic screen operations for scatter plot graphs.
■ Selecting a pen
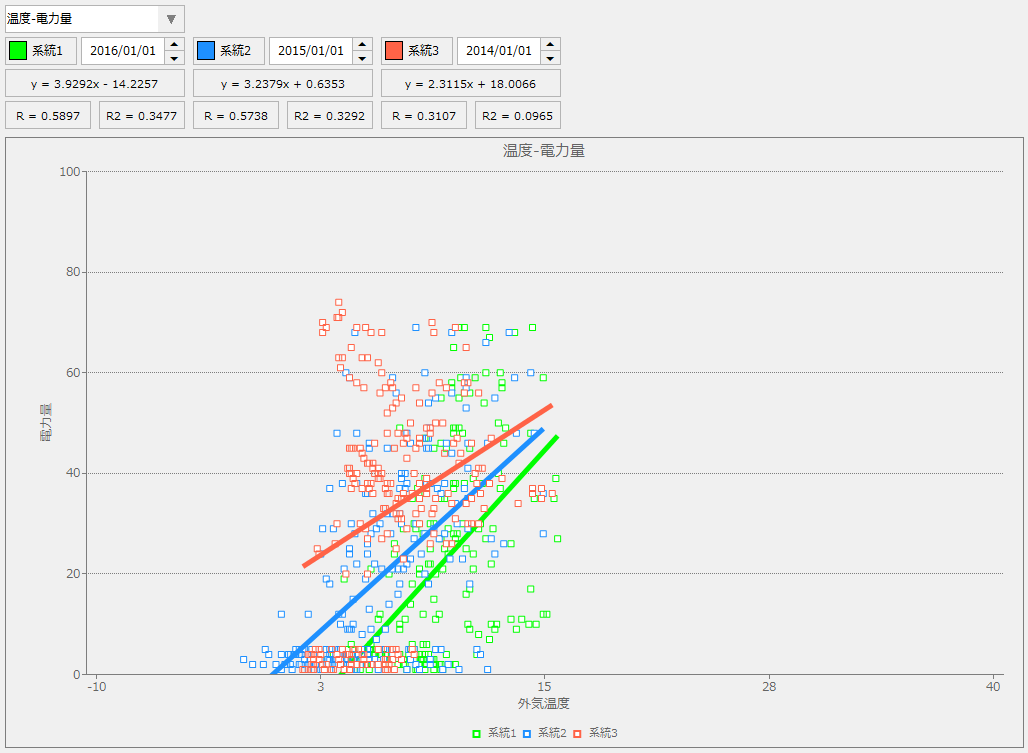
The combo box below at the top of the screen displays the content you entered in "Title" when registering your pen.
You can select the desired pen information from this combo box.

■Select the date to display
Select the date for the data to be displayed for each line from the combo box at the top of the screen.

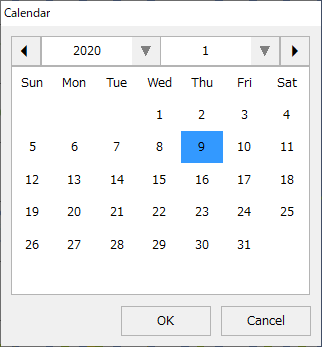
When you click on a date, the following selection dialog will be displayed. You can also use the spin buttons (up and down buttons) to select a date.
(Date selection dialog)
■Selecting the display color
You can select the display color for each system by clicking the following buttons at the top of the screen.

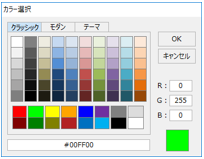
Clicking the button will display the color selection dialog below, so select the desired color.
(Color selection dialog)
■ Show/hide graph
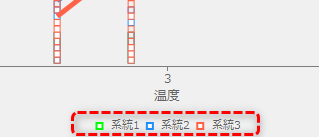
You can show/hide the graphs for each category by clicking the legend displayed at the bottom of the graph.
■ Show/hide the settings menu
Scatter plot graph settings and printing operations are performed from the settings menu.
To display the menu, click the settings icon (gear icon) in the top right corner of the screen.
■ Screen display settings
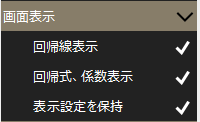
In the "Screen Display" setting menu, you can configure the following display settings.
|
Select Show regression line to show or hide the regression line on the scatter plot graph.
Select "Show regression equation and coefficients" to show or hide the regression line parameters displayed at the top of the screen.
Select "Keep display settings" to keep the display settings of the scatter plot graph screen. If you enable this setting, the previous settings will be inherited when you display a screen other than the scatter plot graph and then redisplay it. |
■ Printing
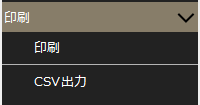
In the "Print" setting menu, you can perform the following operations.
|
If you select Print, a hard copy of the currently displayed graph screen image will be printed.
By selecting CSV output, you can save the data of the currently displayed graph to a CSV file. |