overview
Pen settings for scatter plot graphs are done from the Pen Settings screen while the client is running.
The following explains the details of the pen setting operation for scatter plot graphs. Note that the following operation should be performed while both Panel Server and Panel Browser are online and running.
•Displaying the pen settings dialog
Display the pen settings dialog
Pen settings are done from the Pen Settings dialog, which can be called up from the menu on the scatter plot graph screen.
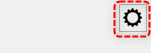
To display the menu, click the settings icon (gear icon) in the top right corner of the screen.
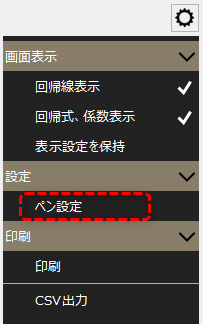
Select "Pen Settings" from the menu displayed on the right side of the screen.
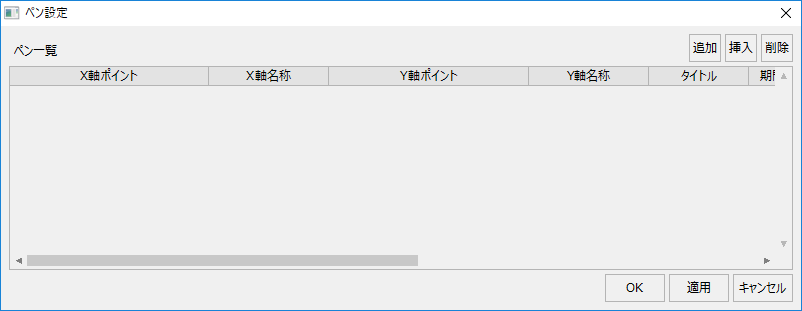
The pen settings dialog box appears.
The following describes how to add a pen.
|
There are currently no pens registered in the group listed above.
To add a pen, click the "Add" button in the top right corner of the pen list.
|
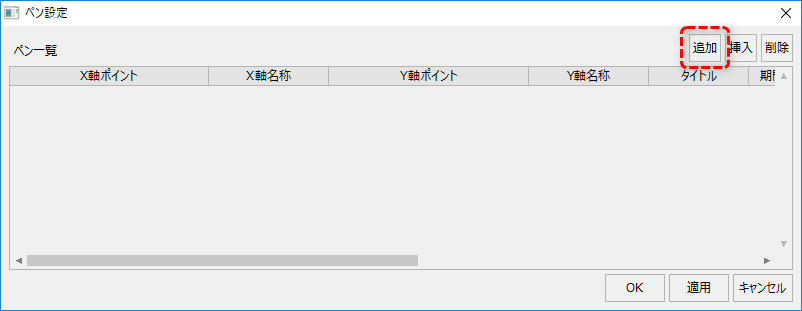
|
Then a new line was added.
When configuring the pen, you need to select the data source you want to display for the X and Y axis points.
To select a data source, click the button on the left.
|
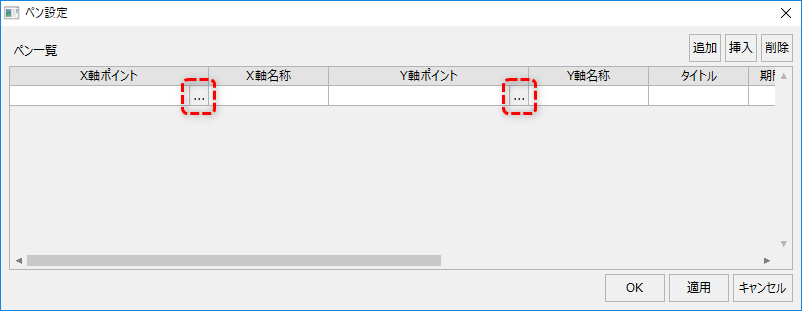
This will display the data source selection dialog.
|
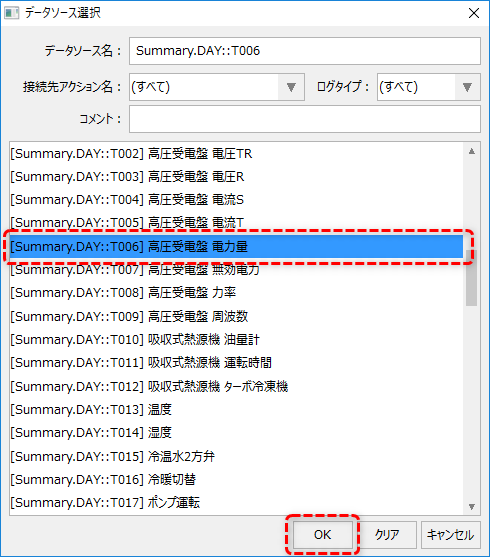
Select the desired data source from the list of data sources and click the OK button.
The data source list displays all selectable data sources. The content displayed here varies depending on the master definition of the summary action. For standard projects, the data displayed at the beginning with "Summary.RAW::" is raw data, "Summary.DAY::" is daily summary data, "Summary.MONTH::" is monthly summary data, and "Summary.YEAR::" is annual summary data.
In the example on the left, the power consumption is selected as the daily report aggregation unit (DAY).
|
Below is an example where the X-axis point is the daily temperature and the Y-axis point is the daily power consumption. You can freely change the names.
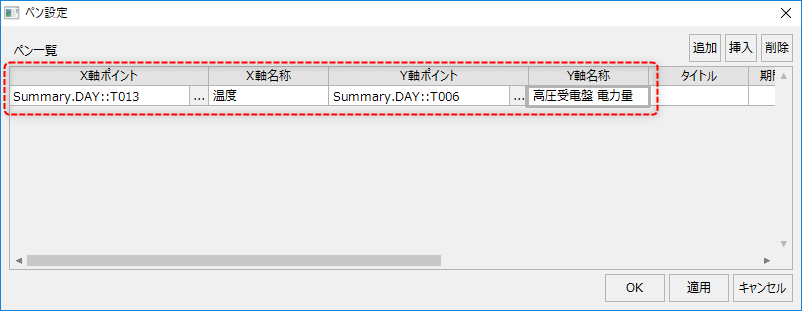
Next, register other information about the pen. The columns for each setting value are on the right side of the list. If the display is cut off, use the scroll bar to display it.
|
|
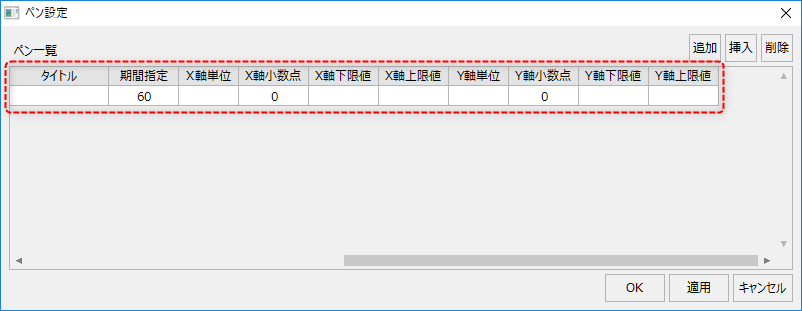
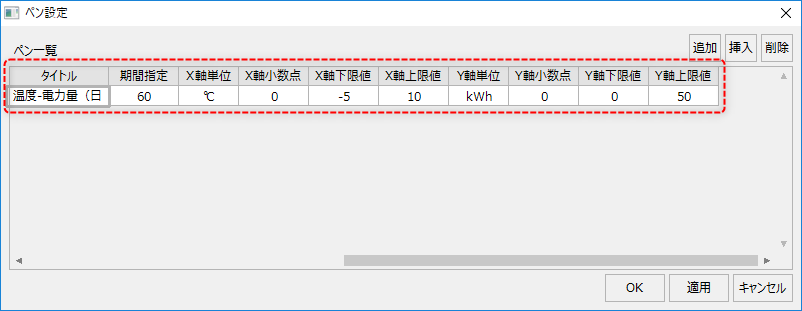
The meaning of each item is as follows. For details on the appearance and custom properties of each display, see "Scatter Plot Chart" in the Library Reference.
item |
explanation |
title |
Specify the title of the pen setting. Enter any text you like (e.g. "Temperature - Power consumption (daily report)"). |
Period specification |
Specify the number of days from the specified date for which to retrieve data for the graph display. Of the data for the number of days specified here, the target data will be retrieved with the "_DataMax" custom property value as the upper limit. |
Units (X-axis, Y-axis) |
Specifies the units of the axis. |
Decimal point (X-axis, Y-axis) |
Specifies the number of decimal places. |
Lower limit (X-axis, Y-axis) |
Specify the lower limit of the values to be displayed. If the value obtained from the actual data is smaller than the value specified here, the minimum value obtained from the data will be used as the lower limit. |
Upper limit (X-axis, Y-axis) |
Specify the upper limit of the values to be displayed. If the value obtained from the actual data is greater than the value specified here, the maximum value of the values obtained from the data will be used as the upper limit. |
Once you have finished editing, click the OK button to save the settings.
Below is an example configuration.