Trend graph control (TrendGraph)
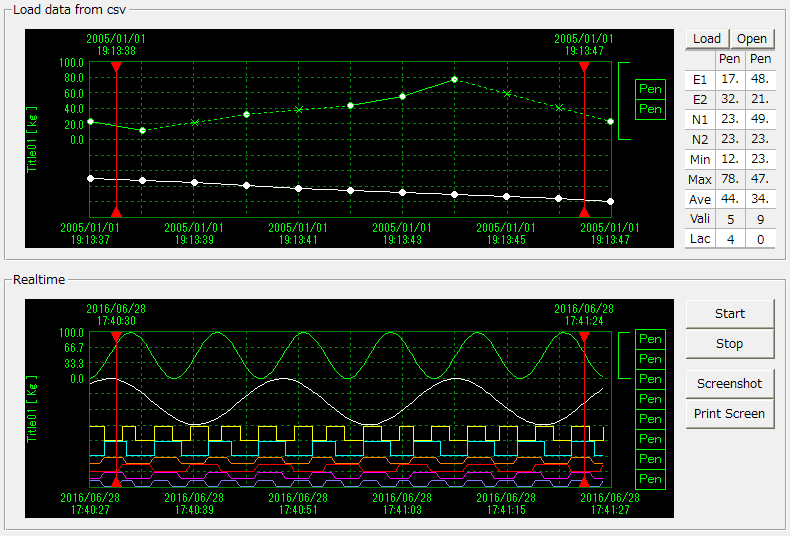
Trend graph control displays time series data in a graph.
Steps for viewing data
Differences from Histrical data graph control
|

|
<< Click to Display Table of Contents >> Manual > Control Reference > Data > Trend graph control |
Trend graph control (TrendGraph)
Trend graph control displays time series data in a graph.
Steps for viewing data
Differences from Histrical data graph control
|