Trend Graph Screen

<< Click to Display Table of Contents >>

Manual > Client Configuration Guide > About FA-Client >

Trend Graph Screen

overview

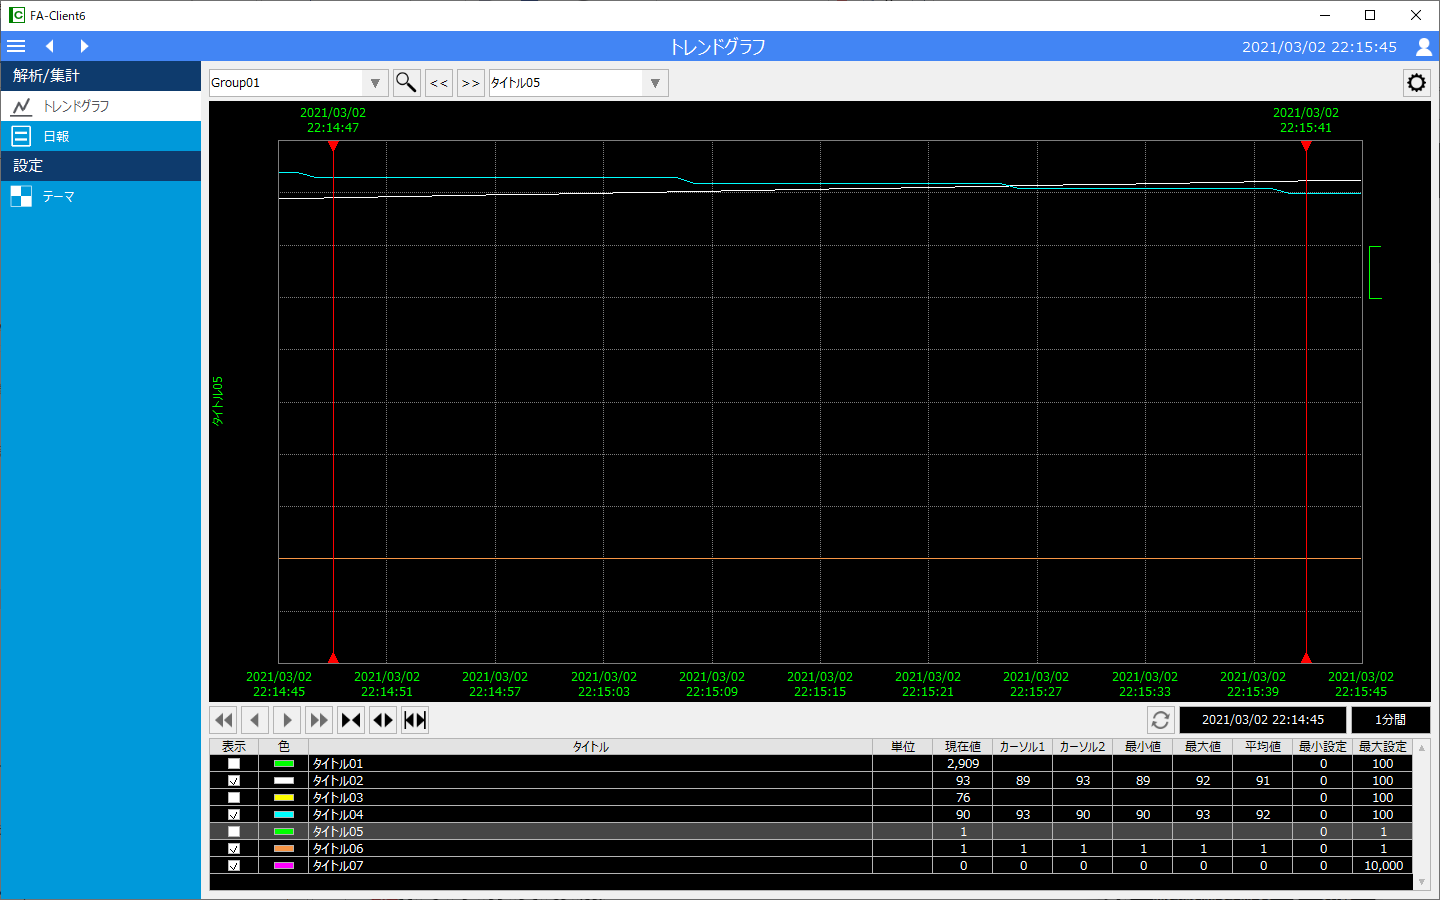
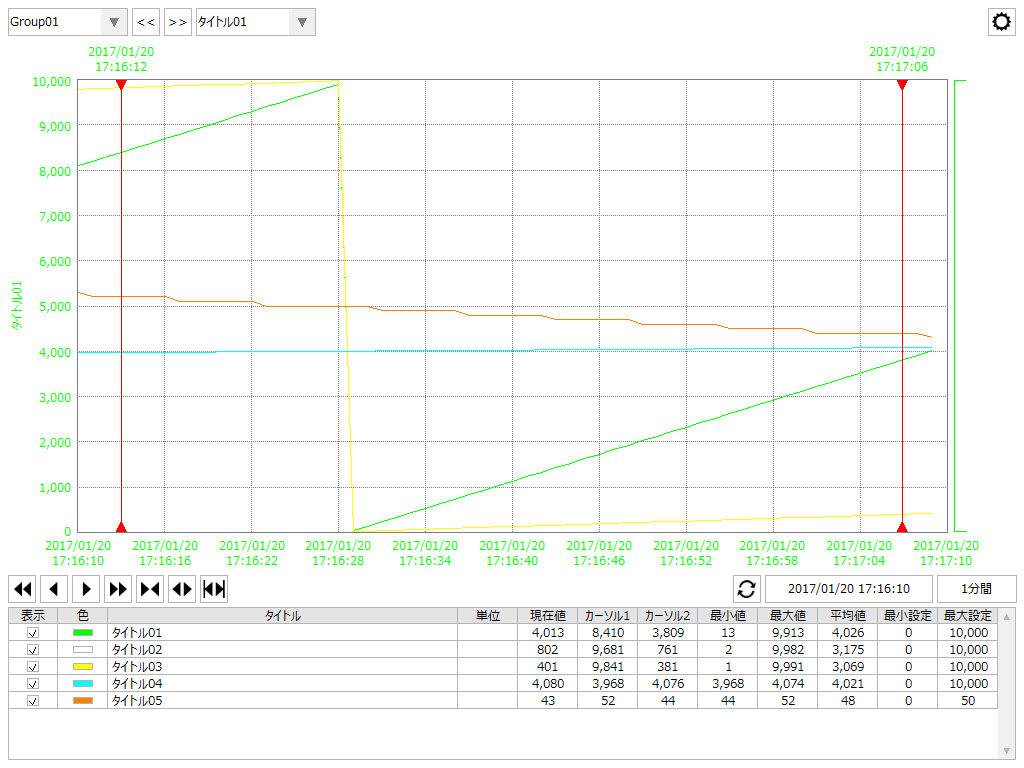
This is the trend graph screen of FA-Client.


fas_cl_0004


Screen Explanation

We will explain each operation and item on the screen.


form_trend_002


#

name

explanation

1

Group Name


Select the group to display in the graph area. A group contains multiple pens.

2

Pen name


Select the pen to be displayed as active. When the pen is displayed as active, the title, color, and graph scale will be displayed as the pen.

3

Settings Menu


Opens the settings menu. For details on the settings menu, please refer to "Settings Menu".

4

Graph Area


The current start time and data for the display period are displayed in a graph.


The following operations are available in the graph area:


Magnification
Select the part of the graph area you want to enlarge with the mouse and the area will be enlarged.
form_trend_021_zoom60
 

Cursor Operation
You can specify the range of each data to be displayed in the pen list by moving Cursor 1/Cursor 2 with the mouse.
form_trend_022
 

Display upper/lower limit operation
If multiple pens overlap and are difficult to see, you can shift the overlap by moving the upper and lower display limits.
form_trend_023


5

Movement and scaling


form_trend_015


The graph display area moves to the past or future based on the period set in the display period.

1.The graph set for the display period will be moved to one page of past data (for example, 30 minutes interval, 30 minutes ago).

2.The graph set in the display period will be moved to the past data by half a page. (For example, if the interval is 30 minutes, it will be moved to the previous 15 minutes.)

3.The graph set in the display period will be moved half a page to new data (for example, 15 minutes later for a 30 minute interval).

4.The graph set for the display period will be moved to the new data by one page (for example, 30 minutes interval, 30 minutes later).


Zooms in and out on the graph.

5.The display period will be narrowed.

6.The display period will be expanded.

7.The graph will be enlarged in the area enclosed by the cursor lines on the left and right sides.


6

Refresh


Move to the current time data.

7

Display date and time


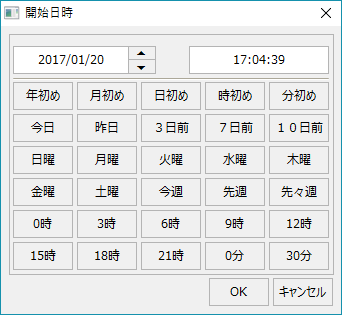
Set the start date and time for the graph. Clicking the start date and time will display the start date and time selection dialog, from which you can select the start date and time.


form_trend_003


8

Display period


Set the graph display period (display span). Click the display period to display the display period setting dialog, from which you can select the display period.


form_trend_004


9

Pen List


The pen information set in the trend group is displayed.

display
Toggles the display of graphs on and off. The graph of the checked pen will be displayed in the graph area.

color
Displays the pen color.

title
Displays the title.

unit
Displays the unit.

Current Value
Displays the current value (the rightmost value displayed on the graph).

Cursor 1
Displays the historical data value at the time indicated by the cursor on the left side of the graph display.

Cursor 2
Displays the historical data value at the time indicated by the cursor on the right side of the graph display.

Minimum
Displays the minimum historical data value within the period bounded by the two cursors.

Maximum
Displays the maximum historical data value within the period enclosed by the two cursors.

Average
The average value within the period enclosed by the two cursors is displayed.

Lower limit setting
Displays the minimum value of the set data.

Upper limit setting
Displays the maximum value of the set data.


Settings Menu

The settings menu will be displayed/hidden each time you click the "Settings" button. The settings menu contains the following:


form_trend_005


#

name

explanation

1

Real-time updates


Switches between real-time display and historical display. When checked, it is real-time display (automatic scrolling), when unchecked, it is historical display.

2

Point Display


Set whether or not to display the plot points of the data.

3

Pen list display


Toggles display of the pen list. Hiding the pen list allows you to display a larger graph area.

 
form_trend_007_zoom60
 

4

Preserve display settings


The display settings changed from the screen will be retained. Note that the setting values are saved for each client.


5

Pen Settings


Displays the pen settings screen.

6

Normal Print


Print screen.

7

Reverse Print


The background of the screen will be changed to white and printed. (Not all colors will be inverted.)

 
form_trend_014
 

8

Save CSV

The data between the two cursors is output in CSV.
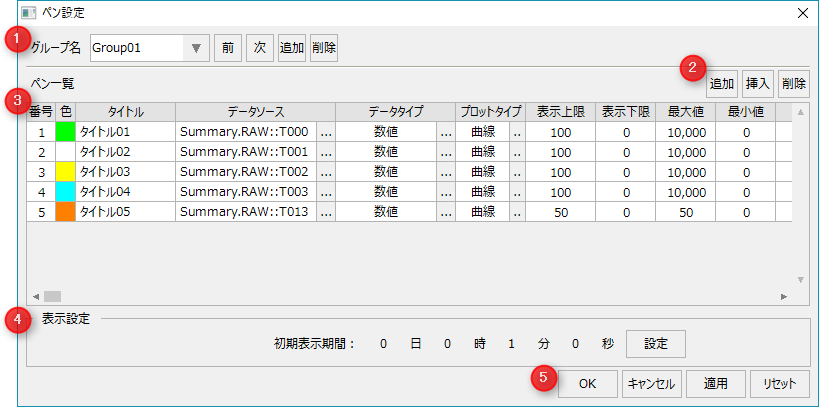
 

form_trend_009


Settings screen

Pen settings screen


This is the settings screen for registering pens. You can edit the settings of the graph pens while the system is in operation.


form_trend_008


#

name

explanation

1

Group Operations


Group Name

Combo Box

Select the group name you want to edit. You can edit the group name directly.

Previous/Next

Switches the registered group name.

Addition/Deletion

Add/remove groups. There is no limit to the number of groups.


2

Pen operation


Add Pen

Add a pen. There is no limit to the number of pens you can have in one group.

Pen Insertion

Insert the pen.

Delete pen

Remove the pen.


3

Pen List


color

Specifies the pen color. Double-click to open the color selector.

title

Specifies the name of the pen.

Data Source

Specify the data source of the pen. Press the button to open the data source settings. Calculations between data sources are also possible.


form_trend_010


■ Data source


Enter the data source. "Standard specification" means that the data source selected from the data source list will be the data source.


"Expression specification" is used when you want to perform calculations between data sources.


form_trend_006


If you check "Calculate assuming undefined values as 0", if the data source in the calculation formula is an undefined value (a value that cannot be obtained due to communication failure, etc.), it will be calculated as 0.


■ List of data sources


Filter data sources by action, log type, and comments.


Data Type

Specifies the data type of the pen data source.


form_trend_011


"Boolean" means 0 or 1 (ON or OFF) for the data source. For "power factor" data, you can specify the data range, the type of power factor data, and whether to display it as a percentage.


Plot Type

Specifies how pens are displayed on the graph.


form_trend_012


"Curve" connects data points with a curve, and "Trigger" connects them in a staircase pattern. "Color Bar" shows the ON/OFF states with a colored bar.


curve
form_trend_017
 

trigger
form_trend_018


Color Bar
form_trend_016
 

rod
form_trend_019


Display limit/
Lower limit

Specify the upper and lower limit positions (0-100%) to be displayed on the graph.

For example, if you set the upper and lower limits to 100(%)/50(%), the graph will be displayed above the middle.
 
form_trend_020
 

Maximum value

Minimum

Specifies the maximum and minimum values that the pen will display.

unit

Specifies the pen units.

Decimal digits

Specifies the number of decimal points the pen displays.

size

Specifies the display size of the pen. The larger the number, the thicker the line will be.


4

Display settings


The display period of the X axis when first displayed. Set for each group. If set to "0 days, 0 hours, 0 minutes, 0 seconds", the display period will not change when switching groups, and will remain the same as the previous display period.

5

OK/
Cancel/
Apply/
Reset


OK

Saves the current edits and closes the settings screen.

cancel

Cancels and closes the current edits.

Apply

Saves the current edits.

Reset

Resets the current edits.