overview
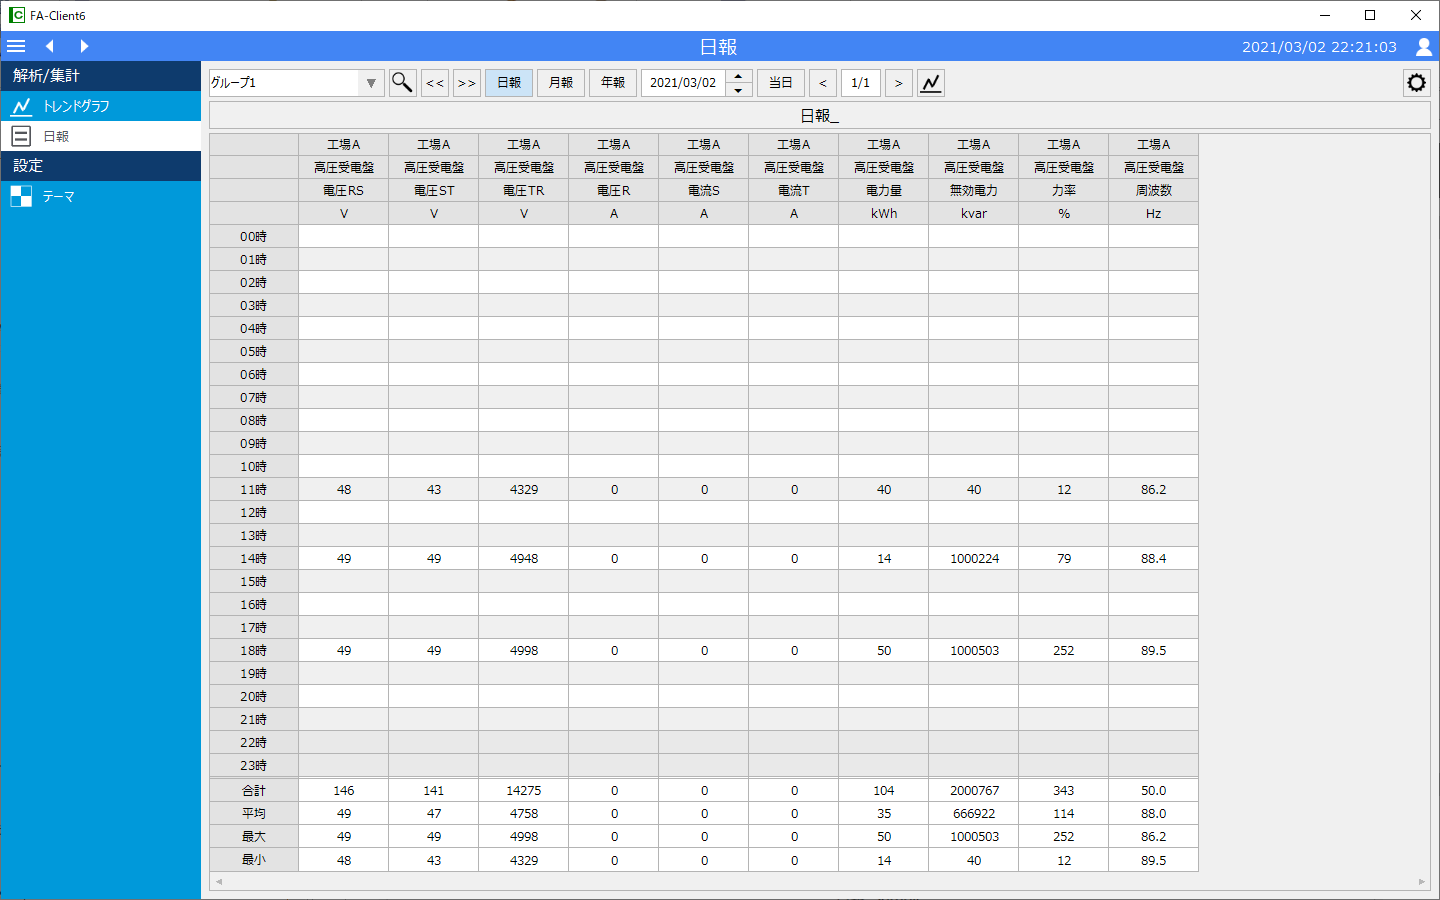
This is the FA-Client report screen (daily report).
Screen Explanation
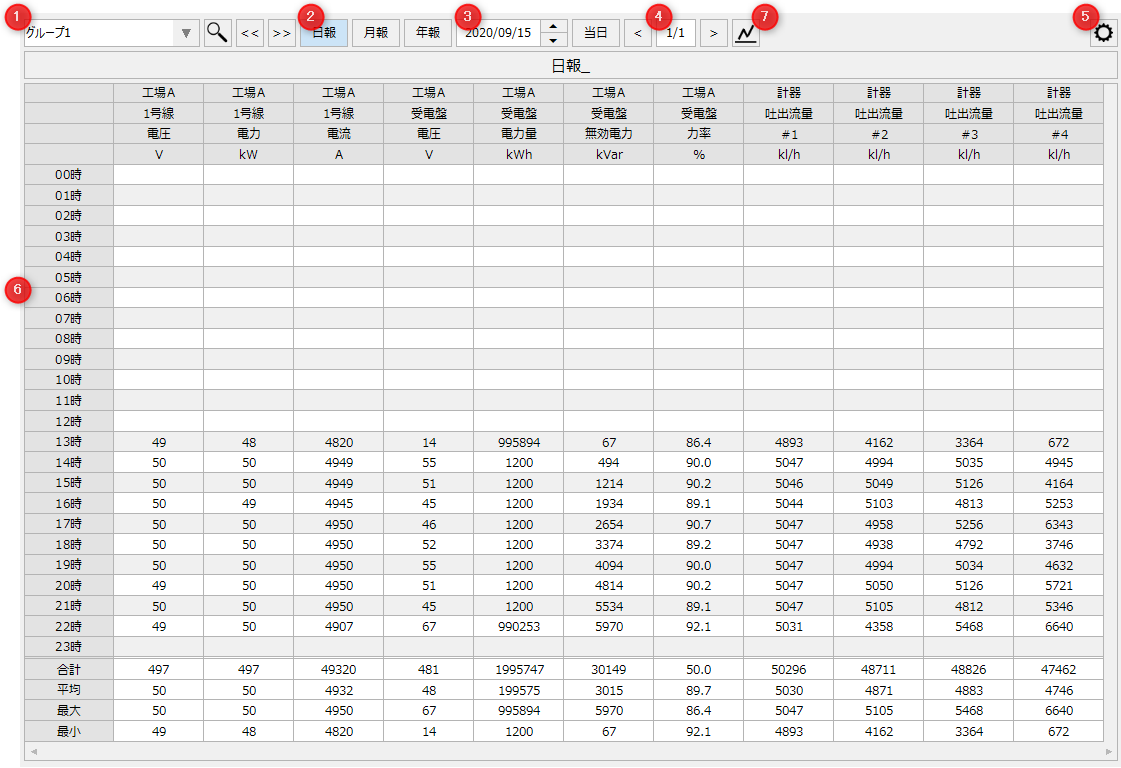
We will explain each operation and item on the screen.
# |
name |
explanation |
||||||
|---|---|---|---|---|---|---|---|---|
1 |
Report group name |
Select the report group to display in the report data list.
|
||||||
2 |
Report Type |
Select the report aggregation unit. "Daily Report" displays aggregated data managed on a daily basis. "Monthly Report" displays aggregated data managed on a monthly basis, and "Annual Report" displays aggregated data managed on a yearly basis.
|
||||||
3 |
Target date |
Select the target date to be displayed in the report data list.
|
||||||
4 |
Page Specifications |
If the report group has multiple pages of data sources registered, this will switch pages.
|
||||||
5 |
Settings Menu |
Opens the settings menu. For details on the settings menu, please refer to "Settings Menu".
|
||||||
6 |
Report data list |
Displays a list of report data according to the report type.
The displayed content changes depending on the document type.
In addition, the following information is displayed in the list for each report type. •Header 1-4 •Total: Display the total value for each row •Average: Display the average value for each row •Maximum: Display the maximum value for each row •Min: Display the minimum value for each row
|
||||||
7 |
Daily Trends |
Displays a pop-up daily trend graph.
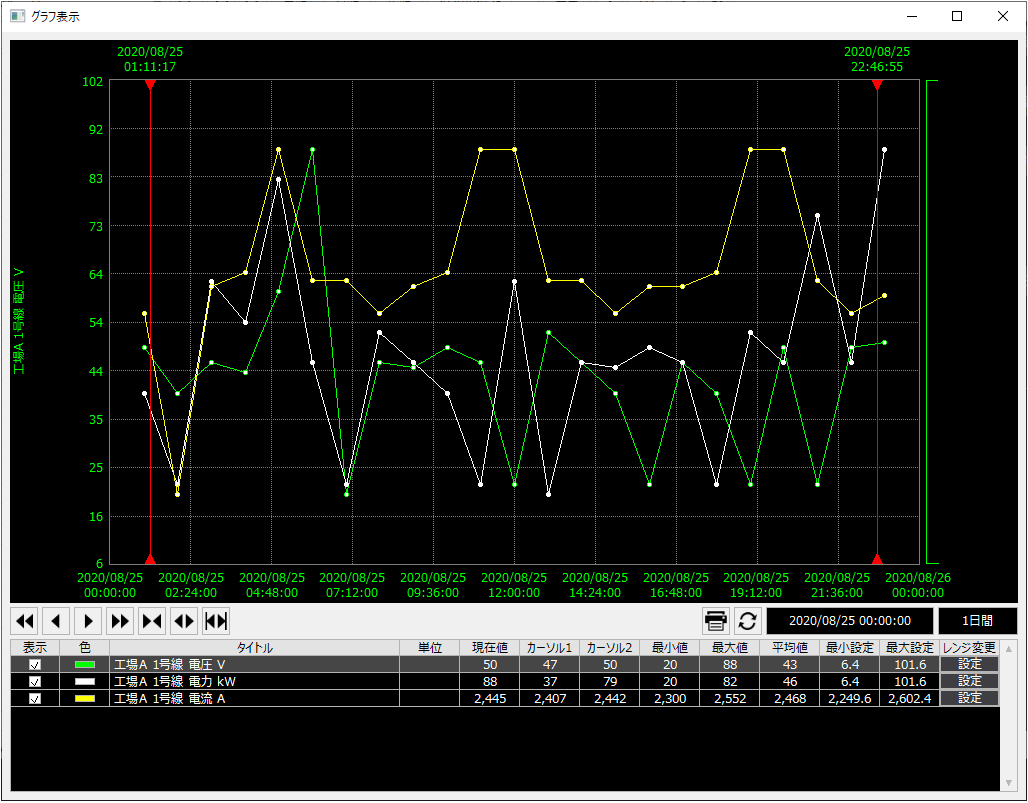
When you select the column of data you want to display in the graph from the grid of the currently displayed report data with the mouse and then click this icon, the following daily trend screen will pop up. The daily trend screen can be operated in the same way as the trend graph screen.
(Daily Trends)
|
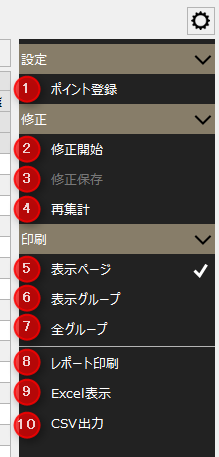
The settings menu will be displayed/hidden each time you click the "Settings" button. The settings menu contains the following:
# |
name |
explanation |
|---|---|---|
1 |
Points Registration
|
|
2 |
Start of correction |
Once you start editing, you will be able to edit the list of form data. To edit, double-click the target cell in the list to enter edit mode.
|
3 |
Save edits |
Save the edits. Once you start editing, this item becomes selectable.
|
4 |
Recount |
Re-aggregate the report data. The currently displayed form data will be re-aggregated by the current form type (Daily/Monthly/Yearly Report).
|
5 |
Display Page |
The processing range for "Report Print", "Excel Display", and "CSV Output" will be "Currently displayed page only".
|
6 |
Display Group |
The processing scope for "Report Print", "Excel Display", and "CSV Output" will be "Currently displayed group only".
|
7 |
All Groups |
The processing range for "Report Print", "Excel Display", and "CSV Output" will be "All Groups".
|
8 |
Report printing |
Print to the printer.
|
9 |
Excel Display |
Generates Excel data and launches Excel. The layout of the generated Excel file will be the same as the image when printed.
|
10 |
CSV output |
Generate CSV data.
|
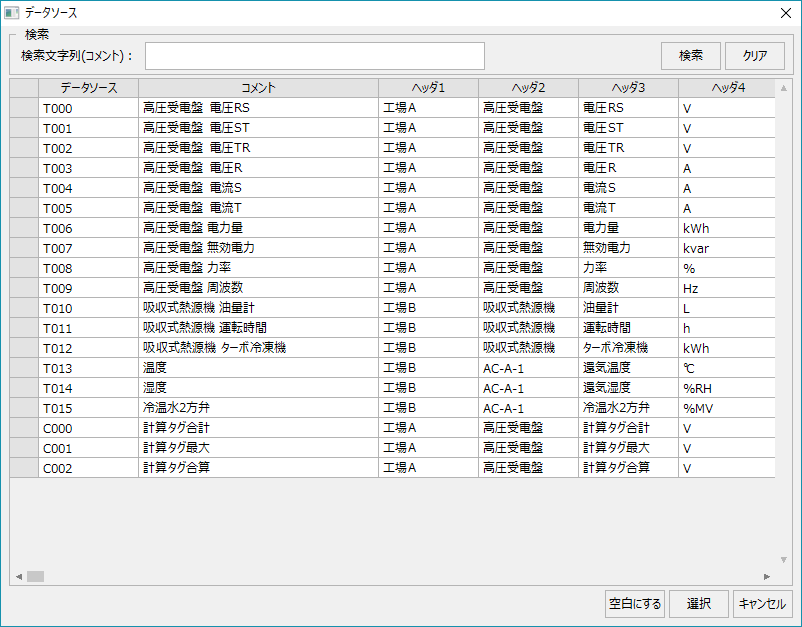
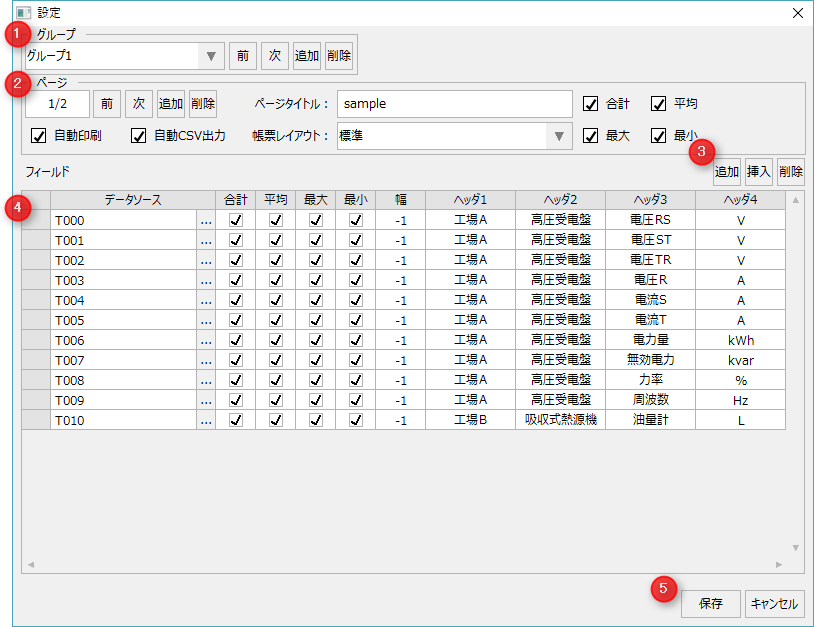
Settings screen
This is the settings screen for registering the data source to be displayed on the form. You can edit the form page settings and column settings for each page while the system is in operation.
# |
name |
explanation |
||||||||||||||||
|---|---|---|---|---|---|---|---|---|---|---|---|---|---|---|---|---|---|---|
1 |
Group Operations |
|
||||||||||||||||
2 |
Page Operations |
|
||||||||||||||||
3 |
Report field operations |
|
||||||||||||||||
4 |
Report Field List |
|
||||||||||||||||
5 |
keep/ |
|