Comparative trend graph screen explanation
# |
name |
explanation |
|---|---|---|
1 |
Group Name |
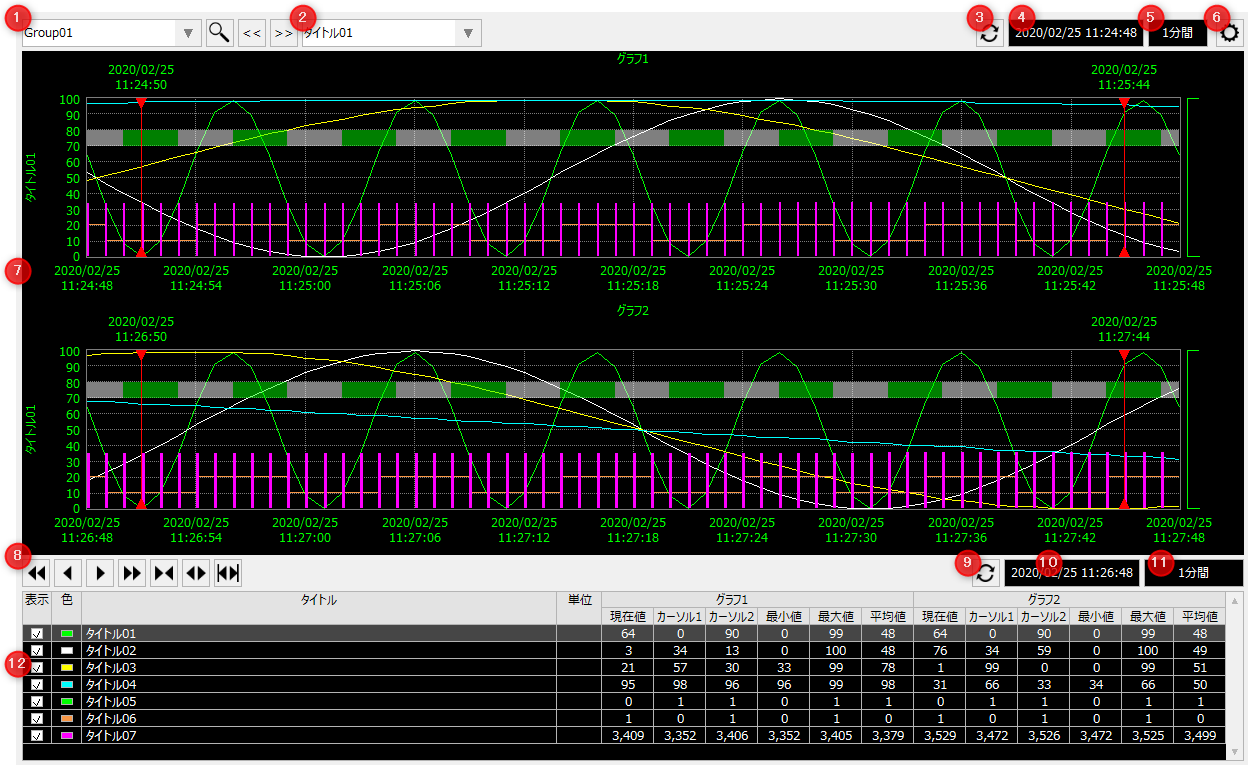
Select the group to display in the graph area. A group contains multiple pens. Click the search icon to display the search dialog, where you can narrow down the pens in the currently displayed group.
|
2 |
Pen name |
Select the pen to be displayed as active. When the pen is displayed as active, the title, color, and graph scale will be displayed as the pen.
|
3 |
Graph 1 Refresh |
Move to the current time data in Graph 1. |
4 |
Graph 1 Display date and time |
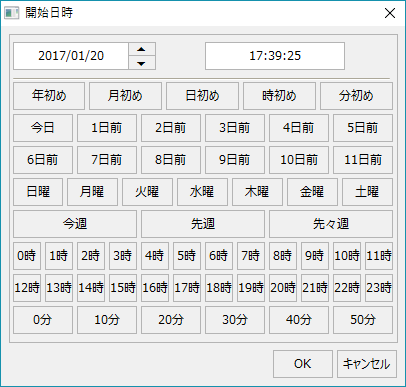
Set the start date and time of the graph in Graph 1. Click the start date and time to display the start date and time selection dialog, from which you can select the start date and time.
|
5 |
Graph 1 Display period |
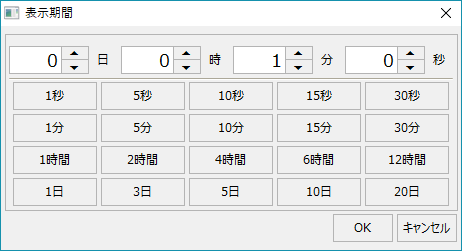
Set the display period (display span) of the graph in Graph 1. Click the display period to display the display period setting dialog, from which you can select the display period.
|
6 |
Settings Menu |
Opens the settings menu. Each time you click the icon, the settings menu will be displayed/hidden. For information on the settings menu, please refer to "Settings Menu".
|
7 |
Graph Area |
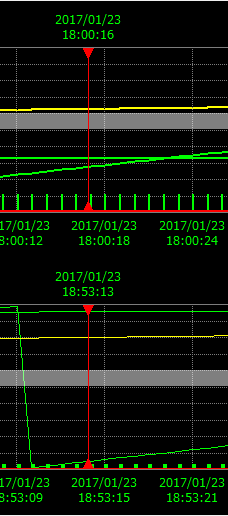
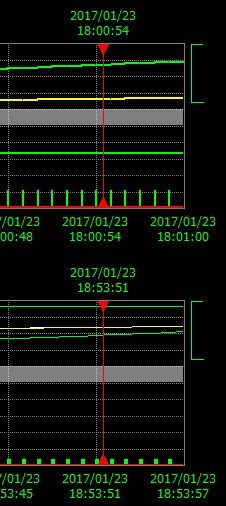
The time series data for the start time and display period specified on the screen is displayed as a trend graph in two areas, Graph 1 (upper part) and Graph 2 (lower part).
The following operations are available in the graph area:
•Cursor Operation •Display upper/lower limit operation
|
8 |
Movement and scaling |
You can scroll the graph page and enlarge or reduce the display period.
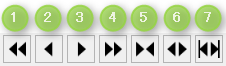
Graph page switching operations: 1.The graph set for the display period will be moved to one page of past data (for example, if the interval is 30 minutes, it will be moved to 30 minutes ago). 2.The graph set for the display period will be moved to the past data by half a page (for example, if the interval is 30 minutes, move to the previous 15 minutes). 3.The graph set for the display period will be moved half a page to new data (e.g., if the interval is 30 minutes, move it to 15 minutes later). 4.The graph set for the display period will be moved to the new data by one page (for example, if the interval is 30 minutes, move it to 30 minutes later).
Zoom in/out the graph period: 5.The display period will be narrowed. 6.The display period will be expanded. 7.The graph is displayed with the full span covering the period enclosed by the cursor on the graph.
|
9 |
Graph 2 Refresh |
Move to the current time data in Graph 2. |
10 |
Graph 2 Display date and time |
Set the start date and time of the graph in Graph 2. Clicking the start date and time will display the start date and time selection dialog.
|
11 |
Graph 2 Display period |
Set the display period (display span) of the graph in Graph 2. Click the display period to display the display period setting dialog.
|
12 |
Pen List |
The pen information set in the trend group is displayed.
•display •color •title •unit
Graph 1/Graph 2
•Current Value •Cursor 1 •Cursor 2 •Minimum •Maximum •Average
|