Comparative Trend Graph
How to read the manual
This chapter is for reference information only.
For the main details, please refer to "Logging/Trend Graphs" in the Monitoring System Construction Guide.
overview
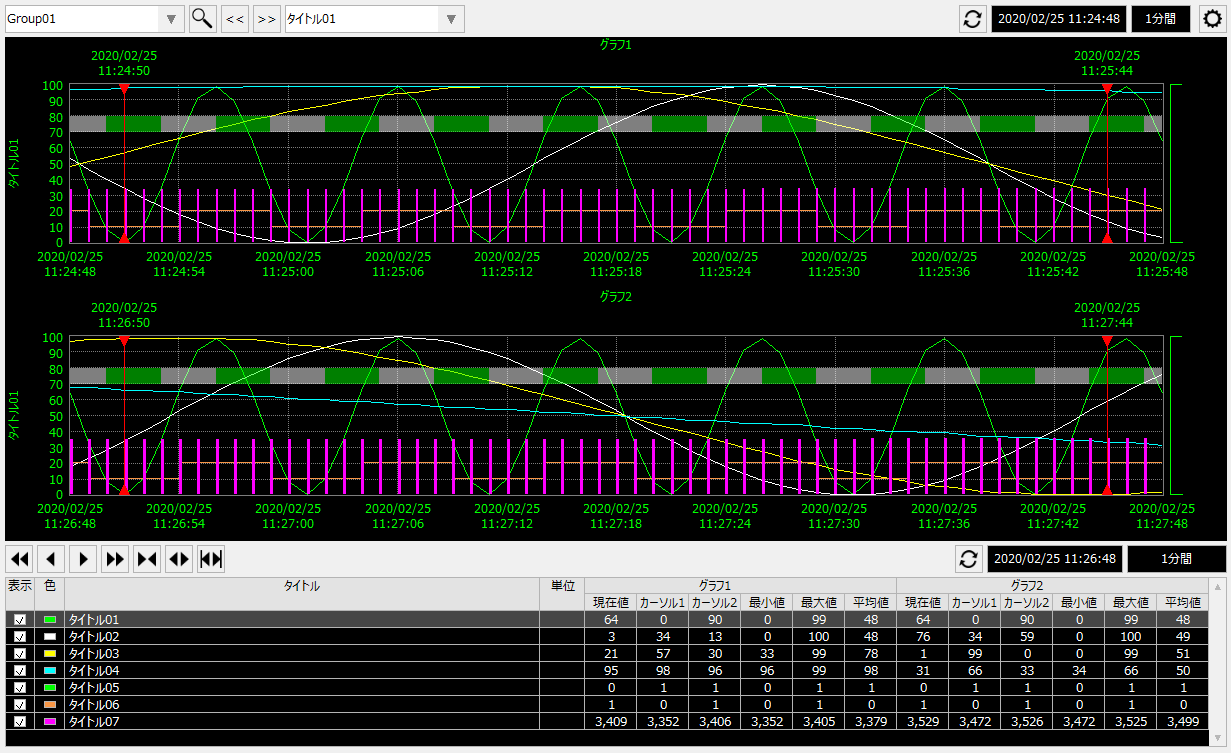
Two time series trend graphs can be displayed for comparison. Two methods for comparison are available: displaying the two graphs side by side, or displaying the graphs themselves overlapping each other. You can freely switch between these methods during operation. The graph display is the same as the display method of the trend graph library.
Please refer to the links below for more details.
|
|
Connected Action
Destination Action Name |
explanation |
|
|
An action for logging and aggregation. It can be specified as a data source for trend graphs.
|
|
|
This is an action that allows simple logging. It can be specified as a data source for trend graphs. |
|
|
This action maps time-series log data generated by external systems, etc., as a data source. It can be specified as a data source for trend graphs.
|
|
|
When saving a pen setting file on the server, you can share the file using the File server action, or via a "public folder" defined in Panel-Interface of Panel Server. If you use the File server action, define the File server action in Panel Server, set the "_PenFilePosition" property to "SERVER", and specify the action name to connect to in "_FileServerName". On the other hand, if you use the public folder function instead of the File server action, there is no need to define the File server action. |
|
Summary actions, logger actions and Historical data server actions can be used with either CSV or ODBC. Note that it is not necessary to define all of these three actions.
|
