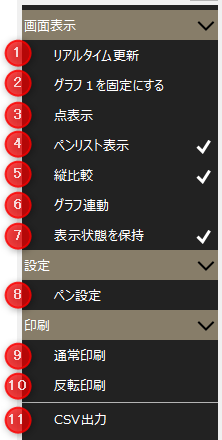
Comparative trend graph settings menu
# |
name |
explanation |
|---|---|---|
1 |
Real-time updates |
Switches between real-time display and historical display. When checked, it is real-time display (automatic scrolling), when unchecked, it is historical display.
|
2 |
Fix graph 1 |
Fixes the display of graph 1 during real-time updates. If this box is unchecked and real-time updates are performed, graph 1 will scroll in conjunction with the real-time display of graph 2, but by checking this box, the display of graph 1 will be fixed and only graph 2 will scroll.
|
3 |
Point Display |
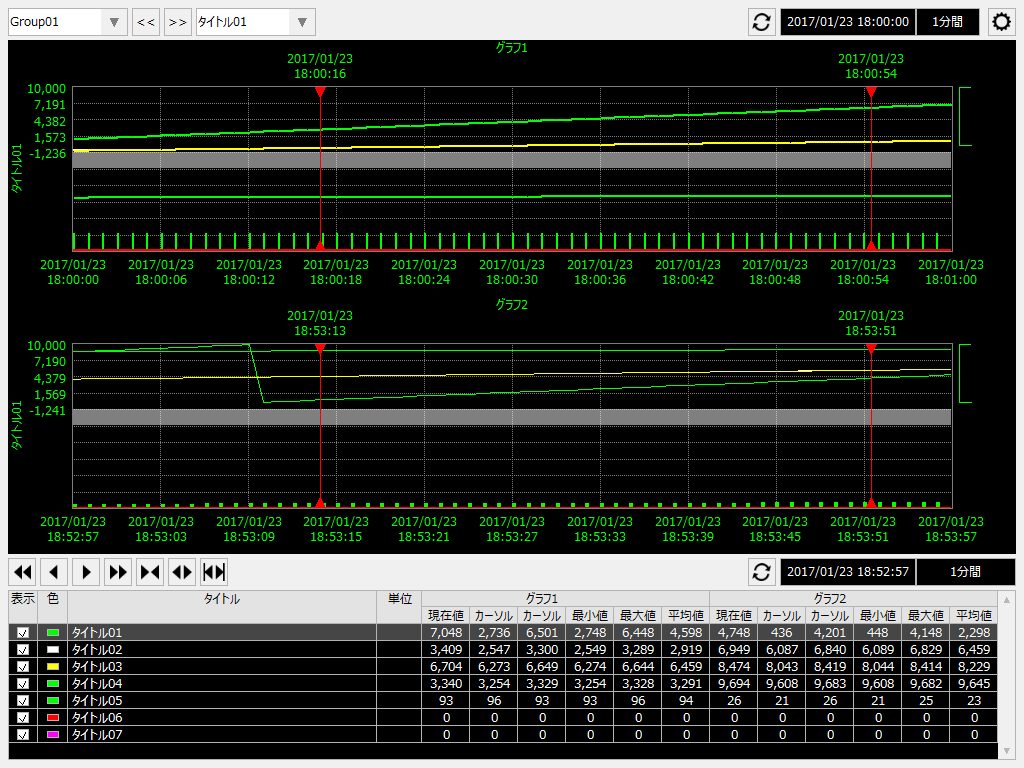
For vertical comparison display, set whether or not to display data plot points. |
4 |
Pen list display |
Toggles the display of the pen list at the bottom of the screen. When checked, the pen list is displayed, and when unchecked, the pen list is hidden.
Hiding the pen list allows you to view a larger graph area.
(Example of not displaying the pen list)
|
5 |
Vertical comparison |
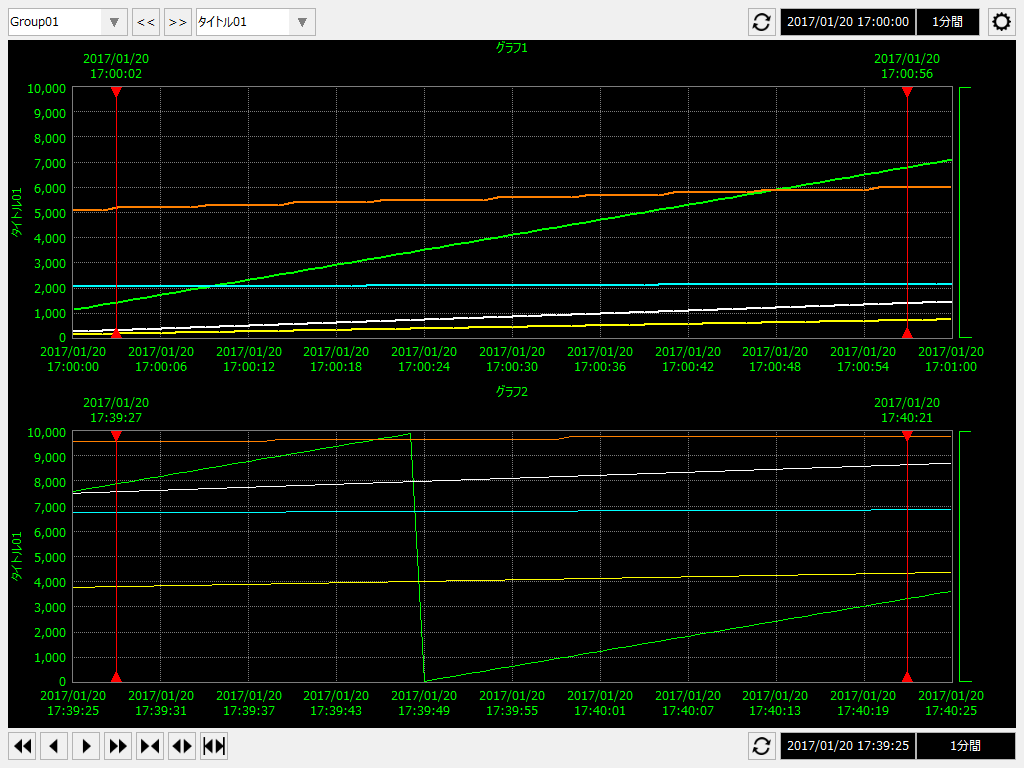
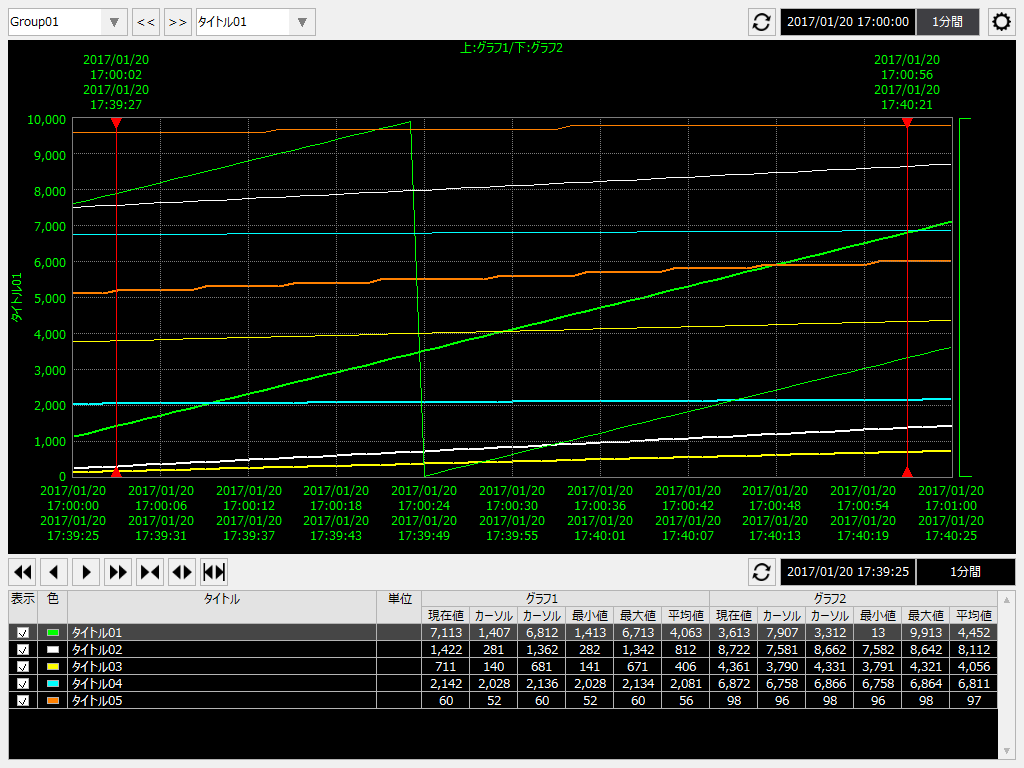
Switches the comparison method of trend graphs. If checked, they will be displayed side by side vertically, and if unchecked, the two graphs will be displayed overlapping each other.
•Vertical comparison checked (vertical comparison display)
•Vertical comparison unchecked (overlapped display)
|
6 |
Graph linkage |
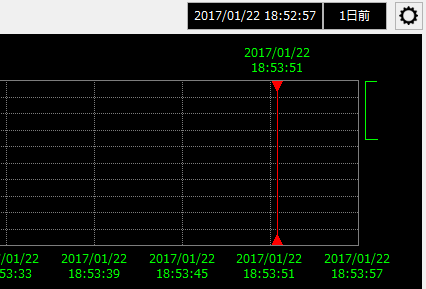
This links the data intervals of graphs 1 and 2. When the graphs are linked, graph 1 will display data from the period prior to the specified period of graph 2. For example, if you link the graphs as shown below and specify 1 day ago for graph 1, graph 1 will display the data from Graph 2 from 1 day ago. Even if real-time updates are enabled, graph 1 will always update to display data from 1 day ago.
|
7 |
Maintain Visibility |
The settings changed on the screen will be retained. Note that the settings are saved for each client.
|
8 |
Pen Settings |
Displays the pen settings screen.
|
9 |
Normal Print |
Print screen.
|
10 |
Reverse Print |
The background of the screen will be changed to white and printed. (Not all colors will be inverted.)
|
11 |
Save CSV |
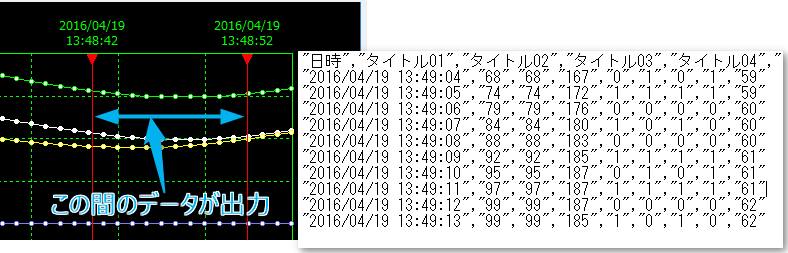
The data between the two cursors will be output in CSV format. The data for Graph 1 will be output to the same file, followed by the data for Graph 2.
|