Comparative Trend Graph Custom Properties
The custom properties of this screen library are as follows:
Basic |
Forwarding server name |
_FileServerName |
default:Not specified
There are two ways to share pen settings on the server side: using the public folder of Panel-Interface or sharing a file via the File server action. Note that if you do not want to share pen settings on the server side (if the "_PenFilePosition" property is "CLIENT"), this setting is not necessary.
■ When using the public folder of Panel-Interface
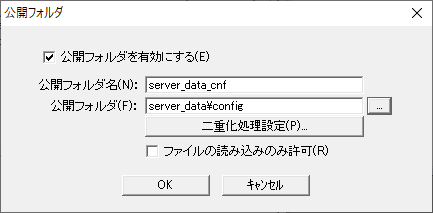
If you want to share the setting information on the server side using the public folder of Panel-Interface, leave this property blank and set the "_PenFilePosition" property to "SERVER". With this setting, the necessary subfolders will be automatically created in the folder defined as the public folder name "server_data_cnf" of Panel-Interface, and the setting information will be saved there. If the public folder has not been created, please refer to the following to create a public folder called "server_data_cnf" from the settings screen of Panel Server. For information on how to register a public folder, please refer to "Panel-Interface Basics".
(Public folder settings for Panel-Interface: server_data_cnf)
•Enable public folder: Check •Public Folder Name: server_data_cnf •Public folder: server_data\config •Allow file reading only: Uncheck
■ When using the File server action
On the other hand, if you want to share the setting information on the server side using the File server action, specify the name of the action to connect to in this property and set the "_PenFilePosition" property to "SERVER". This will save the setting information in the pen file with the file name specified in "_PenFile" in the target folder of the File server action.
|
||||||||||||||||||||
Log Type |
_LogType |
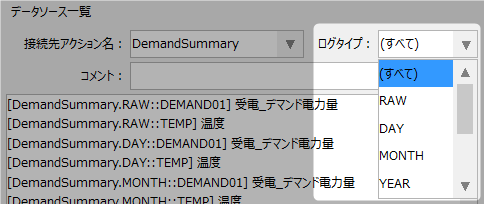
default:RAW;DAY;MONTH;YEAR;SEC10;AVERAGE;MAX;MIN
Defines the log type of the refinement condition used in selecting the data source for setting pen information. However, this condition can only be specified when selecting the data source from a summary action. When adding an aggregation type in a summary action, you can add this information to increase the refinement conditions. Each piece of data is separated by a semicolon (;).
|
|||||||||||||||||||||
Keep your settings |
_IsSaveDisp |
default:True
Specifies whether the screen state is preserved.
|
|||||||||||||||||||||
Show Settings button |
_IsConfig |
default:True
Specifies whether to show or hide the settings button.
|
|||||||||||||||||||||
Output File Output Folder |
_OutFilePath |
default:output
Sets the default folder for output files (CSV output).
|
|||||||||||||||||||||
Output File File name |
_OutFileName |
default:comparetrend
This is the string that will be added to the beginning of the default file name of the output file (CSV output). The default file name will be "_date and time.csv" following this string.
|
|||||||||||||||||||||
Output File Output Type |
_OutFileType |
default:TITLE
Specifies what to output in the header line of the output file (CSV output).
|
|||||||||||||||||||||
Pen File Storage location |
_PenFilePosition |
default:SERVER
Sets how to store the pen information file (CLIENT/SERVER).
|
|||||||||||||||||||||
Pen File Local Path |
_PenLocalPath |
default:config
Set the folder that holds the pen information file. If the "_PenFilePosition" property is "CLIENT", specify a relative path (relative to the client folder). If the "_PenFilePosition" property is "SERVER", this setting is not necessary.
|
|||||||||||||||||||||
Pen File File name |
_PenFile |
default:trend_peninfo.txt
Sets the name of the pen information file.
|
|||||||||||||||||||||
Graph Settings |
Background Color |
_GraphBackColor |
default:@DarkBackColor
Sets the background color of the graph. If you select "Select no color" (leave the property blank), the background will be transparent. If you want to set a background image with "_GraphBackFile", set this property to "Select no color".
|
||||||||||||||||||||
Axis Line Color |
_GraphGridLineColor |
default:@ChartLineColor
Specifies the frame color of the graph.
|
|||||||||||||||||||||
Text Color |
_GraphTextColor
|
default:@ChartTextColor
Specifies the text color for the graph part.
|
|||||||||||||||||||||
Background Image |
_GraphBackFile |
default:Not specified
Sets the background image for the graph. Specify with an absolute path or relative path. To enable the background image, set "_GraphBackColor" to "Select no color."
|
|||||||||||||||||||||
Background Transparency |
_GraphBackFileAlpha |
default:1
Specifies the transparency of the image file specified in "_GraphBackFile." Specify the transparency ratio between "0-1," where 0 is transparent, 0.5 is semi-transparent, and 1 is non-transparent.
|
|||||||||||||||||||||
Pen Grid Settings |
Header Background Color |
_PenGridHeaderBackColor |
default:@GridHeaderColor
Specifies the background color of the grid header of the pen information list.
|
||||||||||||||||||||
Header Text Color |
_PenGridHeaderTextColor |
default:@TextColor
Specifies the text color of the grid header of the pen information list.
|
|||||||||||||||||||||
grid Background Color |
_PenGridBackColor |
default:@DarkBackColor
Specifies the background color of the grid part of the pen information list.
|
|||||||||||||||||||||
grid Text Color |
_PenGridTextColor |
default:#FFFFFF
Specifies the text color of the grid part of the pen information list.
|
|||||||||||||||||||||
grid Line Color |
_PenGridLineColor |
default:@BorderColor
Specifies the border color of the grid part of the pen information list.
|
|||||||||||||||||||||
grid Selection Color |
_PenGridSelectColor |
default:@DarkSelectColor
Specifies the selection color for the grid part of the pen information list.
|
|||||||||||||||||||||
Number of lines displayed
|
_PenGridRows |
default:8
Specifies the number of lines to display in the grid section of the pen information list.
|
|||||||||||||||||||||
Show the pen grid |
_IsGridDisplay |
default:True
Specifies whether to display the grid section of the pen information list.
|
|||||||||||||||||||||
Period setting |
Enabled/Disabled |
_ChangeSpanMode |
default:False
When displaying a historical trend, if the display period in the graph is changed, the data source can be automatically switched to another one depending on the period. Set this property to True to enable automatic switching.
The automatic switching process is performed according to the settings of the related properties "_ChangeSpan" and "_ChangeSpanDataName". For example, by setting the display period to one day or more, you can display thinned data (daily report aggregate data) when displaying long periods, or switch to referencing historical data logged at a different interval, by setting the data source to refer to DAY from RAW. By enabling this setting, you can reduce the screen display load when displaying long-term data.
Note that this property setting is disabled when real-time trends are displayed.
|
||||||||||||||||||||
Span Settings |
_ChangeSpan |
default:86400;2592000;31536000
When "_ChangeSpanMode" is True, set the span period for switching the data source. The setting is in seconds, and periods are separated by ";" (half-width semicolon). The default behavior is to automatically switch the connection to the data source set in "_ChangeSpanDataName" when the span is 1 day or more, 30 days or more, or 365 days or more.
|
|||||||||||||||||||||
Data Settings |
_ChangeSpanDataName |
default:.RAW::/.DAY::/.MONTH::/.YEAR::;LOG.SEC./LOG.DAY./LOG.MONTH./LOG.YEAR.
Set the data source string that will be automatically switched when "_ChangeSpanMode" is True. When setting this property, specify the connection destination information that will be switched by the period separator specified in "_ChangeSpan" by enumerating the source and destination strings.
To specify, list the part of the data source string you want to use as the source string (for example, ".RAW::"), followed by the replacement string you want to replace when the period division number specified in "_ChangeSpan" is +1 (for example, ".DAY::"), separated by a "/" (half-width slash). Also, if there are multiple data sources for the connected server action (for example, when summary actions and logger actions are mixed), write each combination separated by a ";" (half-width semicolon).
Setting example) To set this property, ".RAW::/.DAY::/.MONTH::/.YEAR::;LOG.SEC./LOG.DAY./LOG.MONTH./LOG.YEAR." It is set as follows: "_ChangeSpanMode" is "T" and If "_ChangeSpan" is set to "86400;2592000;31536000", if you change the display period (span) while the graph is displayed, the following behavior will occur.
■If the pen data source is "A01.RAW::T000"
■If the pen data source is "LOG.SEC.T001"
|
|||||||||||||||||||||
Display Data Settings |
Maximum number of data |
_HDSDataMax |
This is the upper limit of the number of data items that can be acquired at one time for graph display. When there is a large amount of target data for the specified span, the maximum number of data items is limited to prevent the screen display from temporarily ceasing. For more information about this property, see also the "RealtimeUpdateMode", "HistoricalUpdateMode" and "UpdateCounterMax" properties in Histrical data graph control.
|
||||||||||||||||||||
How to calculate the maximum and minimum power factor values |
_PowerfactorMaxMinType |
default:TYPE1
Select the method for calculating the maximum and minimum power factor values when displaying power factor data.
|
|||||||||||||||||||||
Display settings |
Initial Value X-axis (seconds) |
_DefaultTimeSpan |
default:0
Specifies the default display period [seconds] that will be set when a pen group is added.
|
||||||||||||||||||||
Initial Value Initial Size |
_DefaultSize |
default:1
The initial pen size when a pen is added.
|
|||||||||||||||||||||
Initial Value Number of decimal places |
_DefaultDecimal |
default:0
The initial decimal point value when adding a pen.
|
|||||||||||||||||||||
Graphical display Cursor Color |
_GraphProbeColor |
default:#FF0000
Specifies the color of the graph cursor (probe).
|
|||||||||||||||||||||
Graphical display OFF Bar color |
_GraphOffBarColor |
default:#FFFFFF
Specifies the OFF color for pens that have "Color Bar" set as the plot type in the pen settings.
|
|||||||||||||||||||||
Graphical display Real-time updates when displayed on screen |
_IsRealTime |
default:False
If True, real-time updates will begin when the screen is displayed.
|
|||||||||||||||||||||
Graphical display Update Cycle |
_UpdateInterval |
default:1000ms
Specifies the update cycle for the screen display when updating in real time.
|
|||||||||||||||||||||
Graphical display Show Milliseconds
|
_IsMillSecond |
default:False
Show milliseconds on the graph.
|
|||||||||||||||||||||
Real-time updates Update Type |
_RealTimeType |
default:SCROLL
If you choose "SCROLL", the screen will scroll from left to right with each refresh.
|
|||||||||||||||||||||
Real-time updates Scroll Percentage |
_RealTimePageRatio |
default:0.4
|
|||||||||||||||||||||
Comparison display settings |
Initial Value X-axis (seconds) |
_CompareSpan |
default:86400
Specifies the initial display period for Graph 1 in seconds.
|
||||||||||||||||||||
Graphical display Graph linkage |
_CompareMode |
default:HOLD
Sets the initial value for graph interlocking. If you specify "HOLD", the data intervals of graph 1 and graph 2 will not be interlocked. If you specify "INTERLOCKING", the data intervals of graph 1 and graph 2 will be interlocked. When the graphs are interlocked, graph 1 will display data from the period before the specified period of graph 2.
|
|||||||||||||||||||||
Graphical display Vertical comparison |
_ComparePos |
default:TOPBOTTOM
Set the initial value for the comparison method of trend graphs. Specifying "TOPBOTTOM" will display them side by side vertically, and specifying "OVERLAP" will display two graphs overlapping each other.
|
|||||||||||||||||||||
Graphical display Comparison line thickness |
_CompareLineSize |
default:1
Specifies the line thickness for the comparison graph (Graph 1).
|
|||||||||||||||||||||
Graphical display Comparison bar thickness |
_CompareBarSize |
default:2
Specifies the thickness of the bars in the comparison graph (Graph 1).
|
|||||||||||||||||||||
Graphical display Comparison Plot Size |
_ComparePlotSize |
default:3
Specifies the thickness of the plot in the comparison graph (Graph 1).
|
|||||||||||||||||||||
Multilingual Settings |
Date and Time Format Name |
_DeteTimeFormat |
default:@DATETIME
Date display format. For details on date and time formats, see "Date and Time Formats" in the Appendix.
|
||||||||||||||||||||
CSV Format name |
_DateTimeFormatCsv |
default:@DATETIME
The format in which dates are displayed when outputting to CSV.
|
|||||||||||||||||||||
Number Format Name |
_NumberFormat |
default:@NUMBER.S
Number display format. For information on number formats, see "Number Format" in the Appendix.
|
|||||||||||||||||||||
others |
Related Information Parameters
|
_SystemRelatedConf |
This is a parameter for use in related information. Do not change this parameter. |