Demand monitoring screen explanation
# |
name |
explanation |
|||||||||||||||||||||||||||
|---|---|---|---|---|---|---|---|---|---|---|---|---|---|---|---|---|---|---|---|---|---|---|---|---|---|---|---|---|---|
1 |
Demand Name |
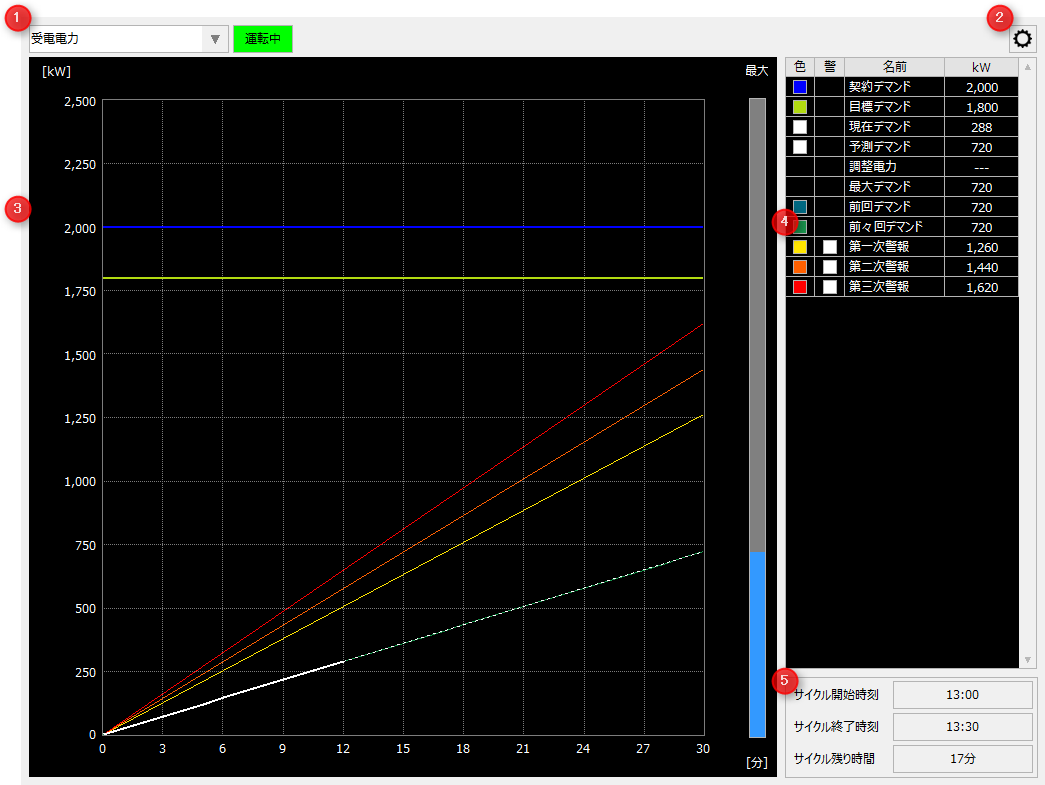
Select the demand to display as active.
Displays the operating status of demand monitoring.
❑Monitoring in progress ❑Suspended |
|||||||||||||||||||||||||||
2 |
Settings Menu |
Opens the settings menu. Each time you click the icon, the settings menu will be displayed/hidden. For information on the settings menu, please refer to "Settings Menu".
|
|||||||||||||||||||||||||||
3 |
Demand Graph |
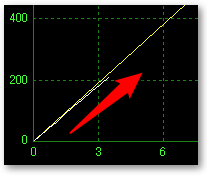
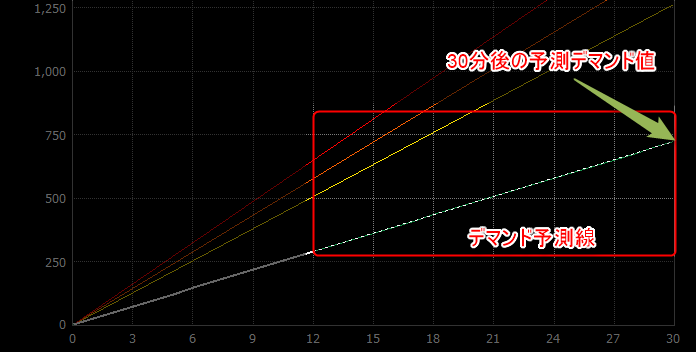
The trend of the demand value is displayed in a graph. When demand monitoring starts, the demand power is plotted over time at each demand update interval. As the counter value (demand tag) of the amount of power registered in the demand settings increases, the graph gradually grows.
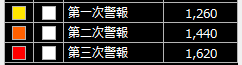
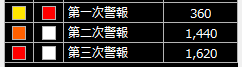
In addition, after the "forecast start time" set in the demand settings has passed, a demand forecast line will be displayed. Here, the value at the end of the demand period (the intersection of the demand forecast line and the 30-minute vertical line) on the extension of the demand forecast line will be the forecast demand power within that demand period. If the demand forecast line exceeds the warning line, a demand warning is detected. The demand warning detection status is displayed in the demand value list. In the following example, the first warning is detected. ❑Normal (white lamp displayed) ❑When an alarm is detected (red lamp displayed) When 30 minutes have passed and the demand time cycle has ended, the graph line display of the demand power in the graph area will be automatically reset. When reset, the previous demand graph will be displayed in the graph area and drawing of the demand graph for the new demand cycle will start.
Furthermore, when resetting, if the demand power value for the current demand cycle exceeds the past maximum demand, the bar graph display of the maximum demand on the right side of the graph will be automatically updated.
|
|||||||||||||||||||||||||||
4 |
Demand Value List |
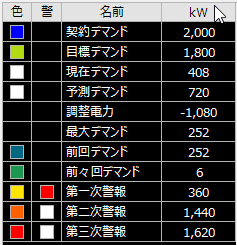
Displays a list of demand monitoring information. Each information item is displayed on one line with the color, alarm status (alarm only), name, and unit.
|
|||||||||||||||||||||||||||
5 |
Demand Cycle |
Displays the cycle time of the demand monitor.
|