Demand history screen explanation
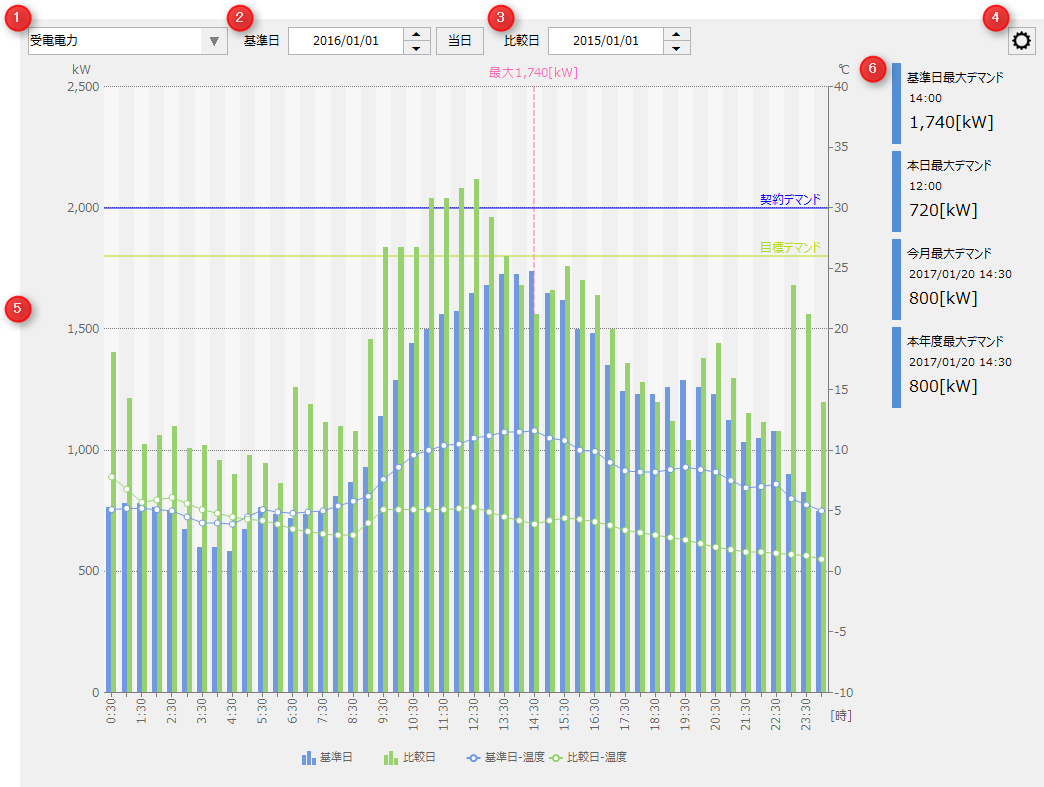
# |
name |
explanation |
||||||
|---|---|---|---|---|---|---|---|---|
1 |
Demand Name |
Select the demand to display as active. |
||||||
2 |
Reference date |
Select the reference date to display in the demand history graph.
|
||||||
3 |
Comparison Date |
Select the comparison dates to display in the demand history graph.
|
||||||
4 |
Settings Menu |
Opens the settings menu. Each time you click the icon, the settings menu will be displayed/hidden. For information on the settings menu, please refer to "Settings Menu".
|
||||||
5 |
Demand History Graph |
View the demand history graph.
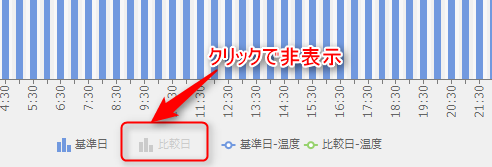
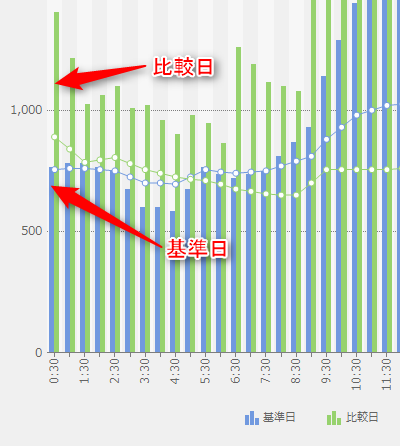
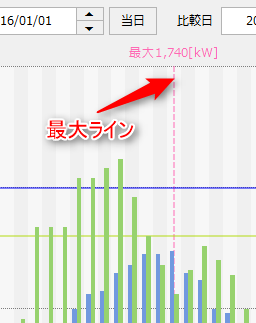
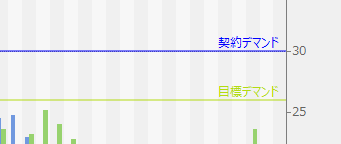
The following data lines are displayed on the graph: •Bar display of demand data for base date and comparison date •The maximum line within the base date. The value is displayed above the line. •"Contract demand line" and "target demand line" set in the demand settings
|
||||||
6 |
Maximum Demand Value |
Displays the maximum demand value and the date and time of the corresponding demand. The displayed content will vary depending on the graph period displayed.
|