1
|
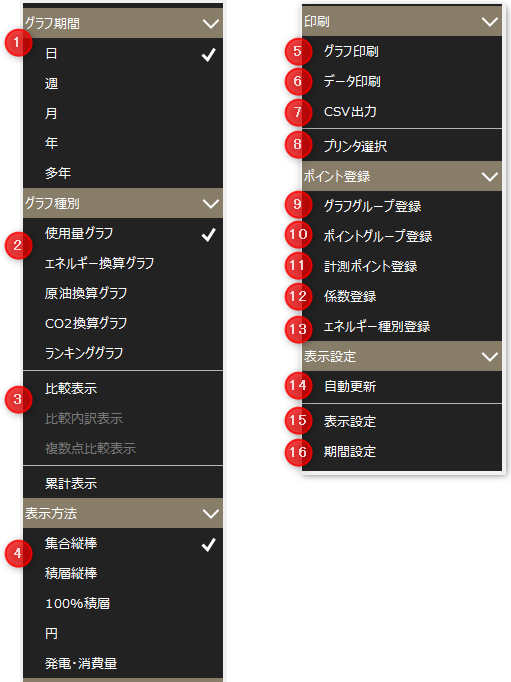
Graph period
|
Switch the graph display period between "Day", "Week", "Month", "Year" and "Multi-year".
day
|
Switches the graph display period to "Daily Report". A graph for up to 24 hours is displayed in hourly units.
|
week
|
Switches the graph display period to "Weekly Report". A graph for one week will be displayed on a daily basis.
|
month
|
Switches the graph display period to "Monthly Report". A graph for one month will be displayed on a daily basis.
|
year
|
Switches the graph display period to "Annual Report". A graph for one year will be displayed on a monthly basis.
|
many years
|
Switches the graph display period to "Multi-year report". Displays the graph for the specified period in years.
|
|
2
|
Graph Type
|
Switch the type of graph to be displayed and switch between comparison display and cumulative display.
Graph Type
|
Usage graph
|
Switch the type of graph to be displayed to "Usage Graph".
|
|
Energy Conversion Chart
|
Switch the type of graph to be displayed to "Energy Conversion Graph".
|
|
Crude oil conversion chart
|
Switch the type of graph to be displayed to "Crude Oil Equivalent Graph".
|
|
CO2 conversion graph
|
Switch the type of graph to be displayed to "CO2 conversion graph."
|
|
Ranking Graph
|
Switch the type of graph to be displayed to "Ranking Graph".
|
|
3
|
Display Mode
|
Switches the graph display mode.
Comparison display
|
Comparison display
|
Switches the graph to comparison view.
|
|
Comparison breakdown display
|
Switch the graph to a comparative breakdown view.
|
|
Multiple point comparison display
|
Switches the graph to a multi-point comparison display.
|
Cumulative display
|
Cumulative display
|
Switches the graph to cumulative display.
|

|
If the "Ranking graph" and graph period are "Multi-annual report", "Comparison display", "Comparison breakdown display" and "Multiple point comparison display" cannot be selected.
|
|
4
|
How to display
|
Switches the graph display method.
Clustered Vertical Bar
|
Displays the graph as a clustered column.
|
Stacked Vertical Bars
|
Displays the graph as stacked columns.
|
100% Laminated
|
Displays stacked bar graphs with the height converted to 100%.
|
circle
|
Displays the graph as a circle.
|
Power generation and consumption
|
When this display method is selected, the data registered as the amount of power generation (energy creation) will be displayed as a negative value. This display method can only be selected when the comparison breakdown display, multiple point comparison display, or cumulative display is selected in the usage graph.
|
|
For "Ranking graphs," only "Grouped bar" can be specified.
|
|
5
|
Graph printing
|
Print the energy management graph.
|
6
|
Data printing
|
Prints the displayed data.
|
7
|
CSV Output
|
The displayed data will be output in CSV format.
|
8
|
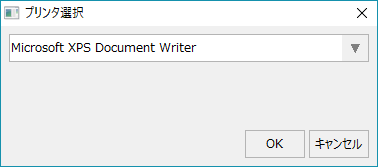
Printer Settings
|
Select the printer to print with Energy Management.
|
9
|
Graph Group Registration
|
Displays the graph group registration screen.
|
10
|
Point Group Registration
|
Displays the point group registration screen.
|
11
|
Measurement point registration
|
Displays the measurement point registration screen.
|
12
|
Coefficient registration
|
Displays the coefficient registration screen.
|
13
|
Energy type registration
|
Displays the energy type registration screen.
|
14
|
Automatic Updates
|
Enables/disables automatic updating of the energy management graph (the "_AutoRefresh" custom property). The timing of automatic updates follows the cycle specified in the "_RefreshTiming" custom property (1HOUR: every hour, 1DAY: every day).
|
15
|
Display settings
|
Display settings screen is displayed.
|
16
|
Period setting
|
Displays the period setting screen.
|