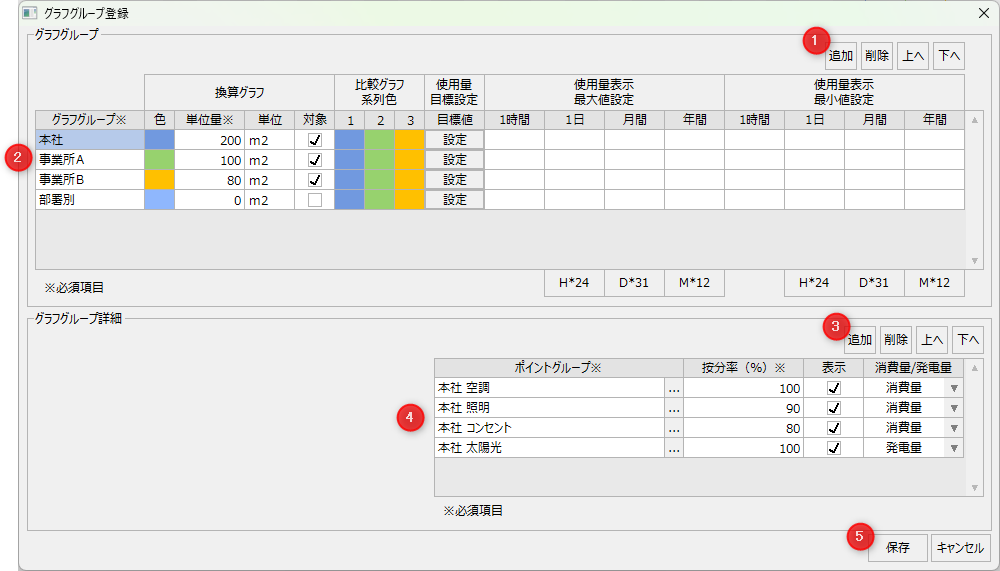
This is the settings screen for registering graph groups.
#
name
explanation
1
Graph Group Operations
addition
Add a chart group.
delete
Delete a chart group.
Up/Down
Change the display order of the graph groups.
2
Graph Group List
Graph Group Name
Specify the name of the graph group.
Conversion Graph
These are settings related to the conversion graphs (energy conversion graph, crude oil conversion graph, CO2 conversion graph).
color
Set the display color of the graph group when the conversion graph is displayed. Double-click to display the color palette and select the display color.
Unit amount
Set the unit amount (denominator) to calculate the energy intensity on the conversion graph.
Example: Energy conversion
Energy intensity = total heat amount / total unit amount
unit
Set the unit of the basic unit for the conversion graph.
subject
Check the graph group you want to display in the conversion graph. Only the graph groups with this setting checked will be displayed in the conversion graph.
Comparison graph series color
Set the display colors for Series 1 to 3 when comparing graphs. Select a display color from the color palette that appears when you double-click.
Usage target value
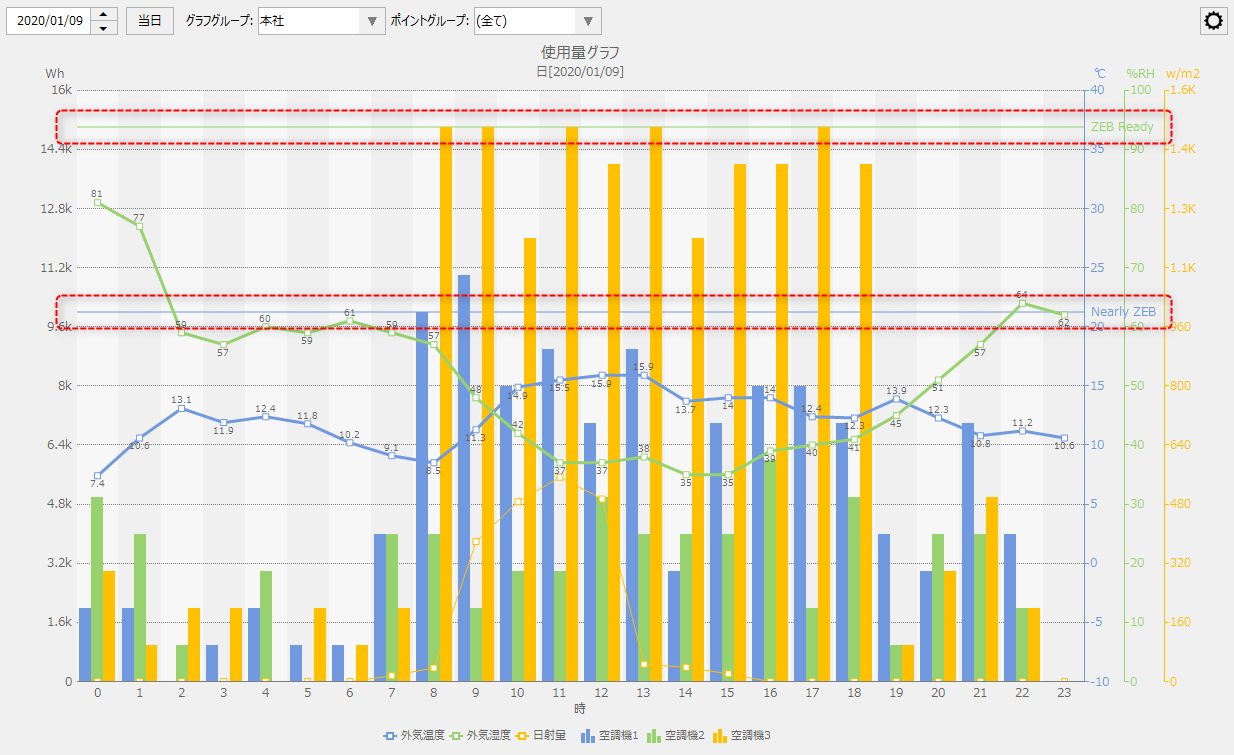
You can set a usage target value for each graph group. By setting a target value, you can display a target line or area on the graph.
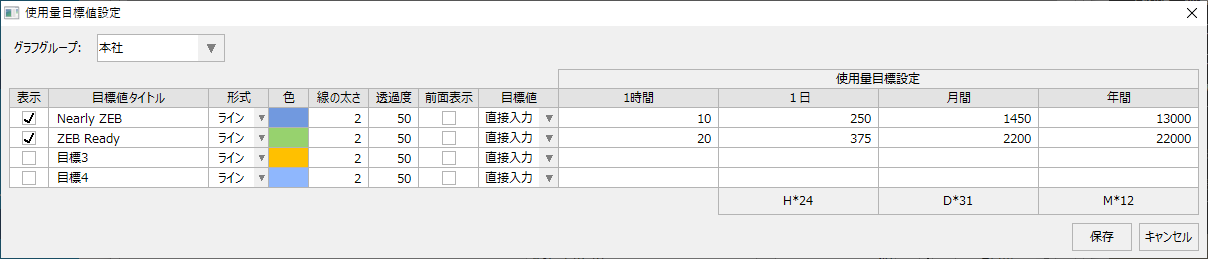
Target values can be set from the settings screen that appears when you click the settings button.
(Graph group/Usage target value setting screen)
display
Check the target values you want to display.
Target Title
Specify a title for the goal.
format
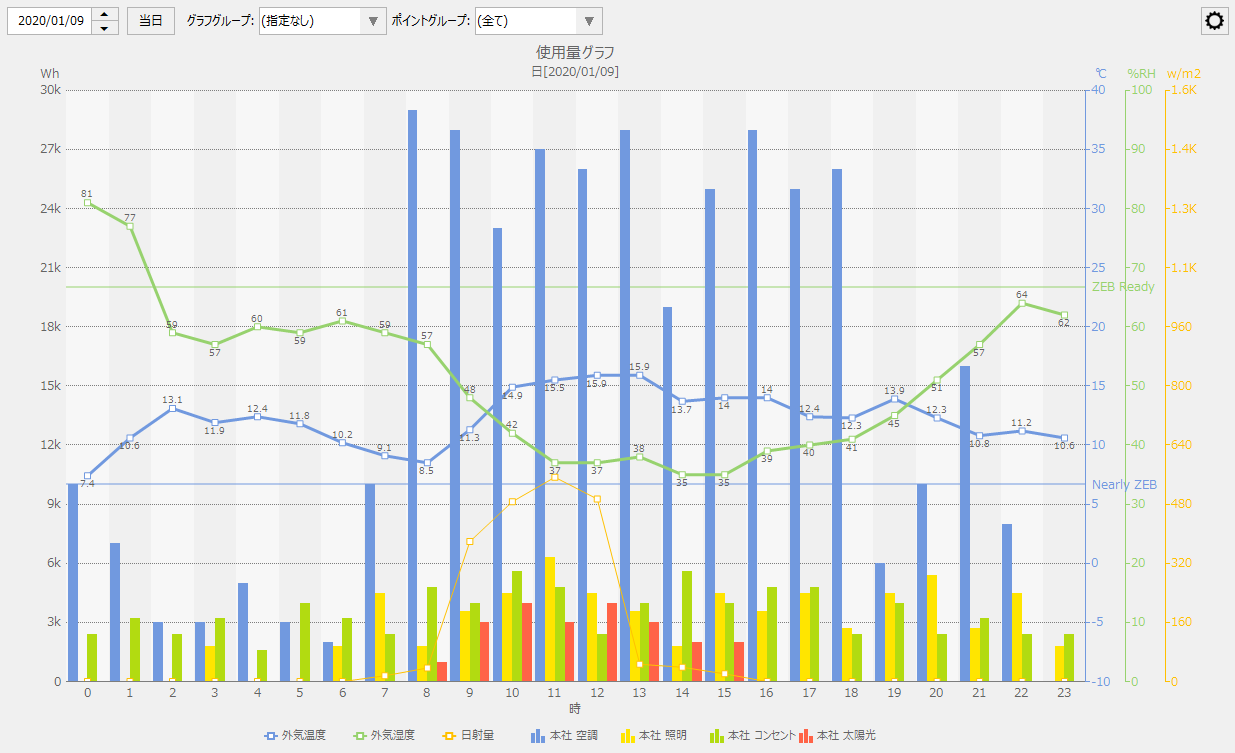
line
The target value is displayed as a line.
(Example of line display)
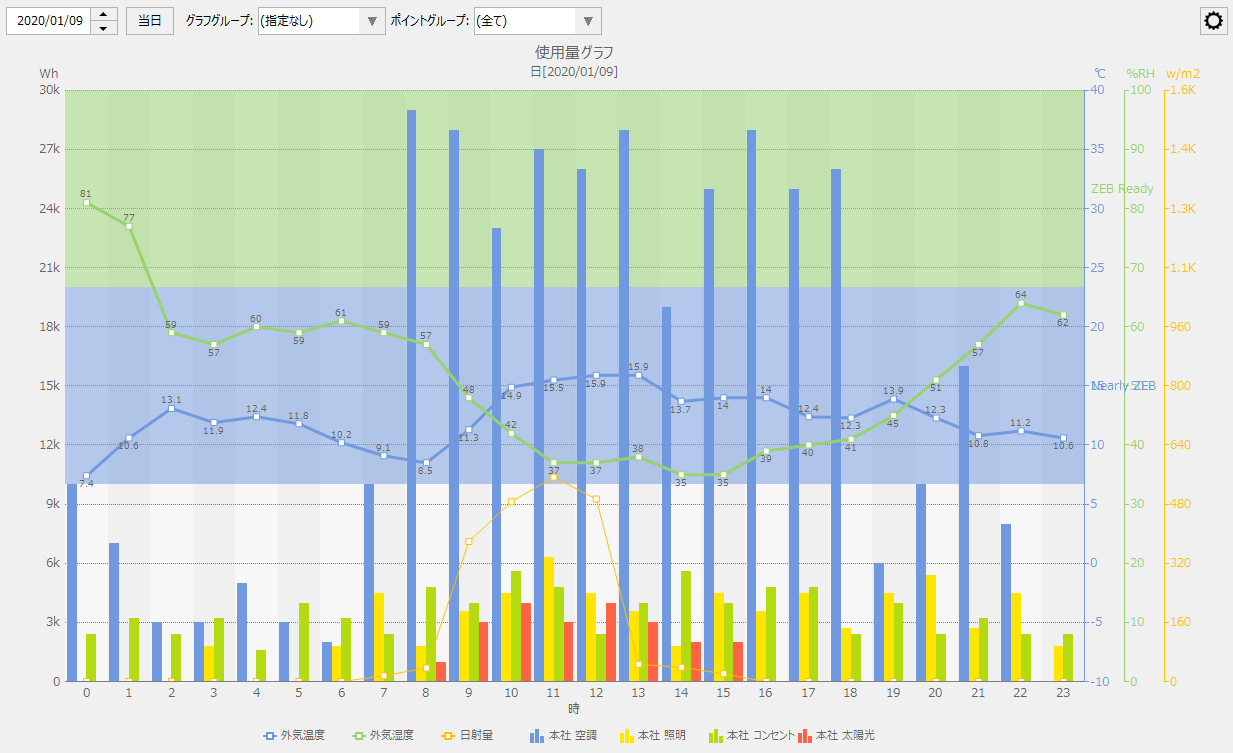
area
The target value is displayed as an area.
(Example of area display)
color
Set the display color for the target value. Double-click to display the color palette and select the display color.
Line Weight
Specifies the line thickness when displaying the target value in line format.
Transparency
Specify the transparency of the target value when it is displayed as a percentage. When displaying an area, you can adjust the visibility of the graph by setting the fill to a lighter color.
Front display
Check this box to display the target value in front of the graph.
How to enter target values
You can choose how to enter the target value.
Direct input
Enter the target value directly as a number.
tag
You can assign tags to goal settings. When you select "Tags", a tag selection button will appear on the grid. You can select tags from the selection screen that appears when you click the tag selection button.
By assigning a tag to a target value, you can dynamically change the target value depending on the tag value.
Usage target setting
Set the graph group usage target value for each hour (day display), day (month display), month (year display), or year (multi-year display).
By clicking the calculation button at the bottom of the usage goal settings, you can easily calculate the following values based on your input.
H*24
Set your daily target value as 24 times your hourly target value.
D*31
Set your monthly goal as 31 times your daily goal.
M*12
Set your annual target value as 12 times your monthly target value.
Maximum usage display value
Set the maximum usage display value for the graph group for each hour (day display), day (month display), month (year display), or year (multi-year display).
By clicking the calculation button at the bottom of the display maximum value setting, you can easily calculate the following values based on the input.
H*24
The daily target value will be set to 24 times the hourly target value of the maximum usage display setting.
D*31
Set your monthly goal as 31 times your daily goal.
M*12
Set your annual target value as 12 times your monthly target value.
Minimum usage value
Set the minimum usage display value for the graph group for each hour (day display), day (month display), month (year display), or year (multi-year display).
By clicking the Calculation button at the bottom of the Minimum Display Value setting, you can easily calculate the following values based on your input.
H*24
The daily target value is set to 24 times the hourly target value of the minimum usage display setting.
D*31
Set your monthly goal as 31 times your daily goal.
M*12
Set your annual target value as 12 times your monthly target value.
3
Point Group Operations
addition
Add a point group.
delete
Deletes a point group.
Up/Down
Moves the display order of point groups.
4
Point Group List
Point Groups
From the registered point groups, select the point groups to be included in the graph group.
Proportion rate
Set the percentage of the selected point group to be allocated and imported into the graph group. If you do not want to allocate, set it to 100%.
display
•When in graph usage mode
Point groups with this setting unchecked will be excluded from display.
•When the display mode is Energy conversion, Crude oil conversion, or CO2 conversion
Only the usage data contained in the point groups that have this setting checked will be included in the calculation of the conversion total (i.e. point groups that are unchecked will be excluded from the conversion graph display).
Consumption/power generation
In the graph group, select the consumption or power generation (energy creation) category for the usage of the point group you want to add.
Consumption
The usage amount of the relevant point group will be treated as consumption.
Power generation
The usage amount of the relevant point group will be treated as the amount of power generation (energy creation). When the amount of power generation is selected, it will be displayed as a negative value when the graph display method is set to "Power generation/consumption."
5
keep/
Cancel
keep
Saves the current edits and closes the settings screen.
cancel
Cancels and closes the current edits.
Point group registration screen
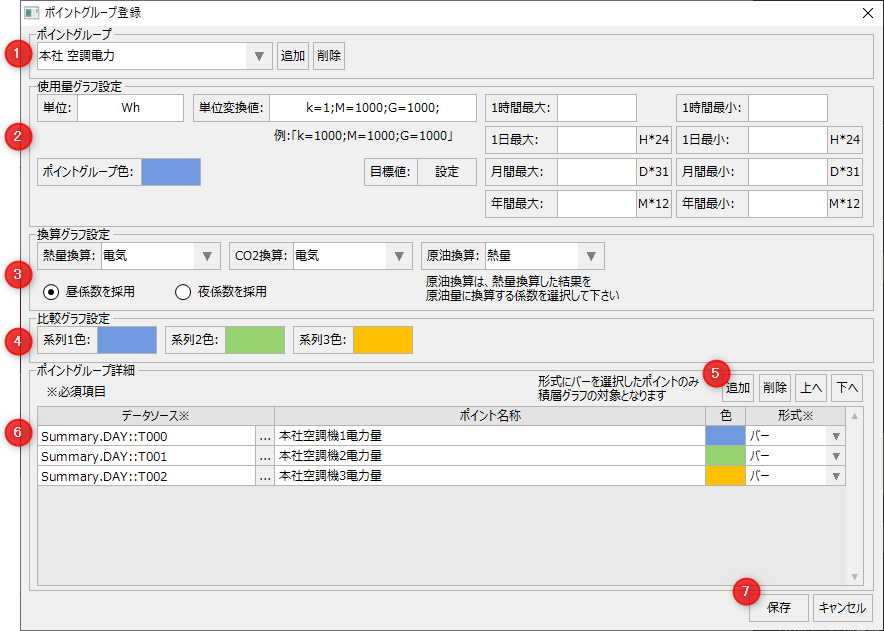
This is the settings screen for registering point groups.
#
name
explanation
1
Point Group Operations
Point Group Name
Select the point group name you want to edit. You can edit the name directly.
Add/Remove
Add/remove point groups. There is no limit to the number of groups.
2
Usage graph settings
Configure the settings for the usage graph.
unit
Sets the units for the point group.
Unit Conversion Values
Set this if you want to automatically convert units when displaying a graph. Specify the conversion string to be added to the unit along with the number of conversion digits. Specify the digit information for automatic conversion using a ";" (half-width semicolon) as a separator.
Example: When the unit of the point measurement value is Wh
Set "k=1000;M=1000;G=1000". Specify "Wh" as the unit.
For 1000Wh, it is converted to 1kWh. Convert 1000kWh to 1MWh, and 1000MWh to 1GWh.
Example: When the unit of the point measurement value is kWh
Set "k=1;M=1000;G=1000". Set the unit to "Wh".
1kWh converts to 1kWh, 1000kWh converts to 1MWh, and 1000MWh converts to 1GWh.
Point Group Color
Set the display color of the point group in the usage graph. Double-click to display the color palette and select the display color.
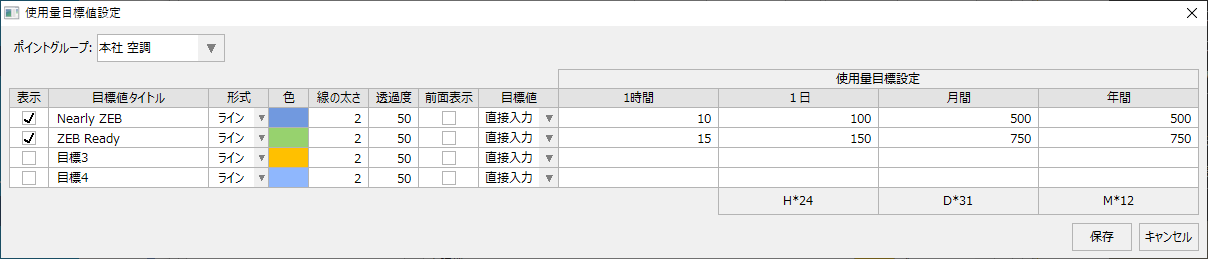
Target value
You can set a target usage amount for each point group. When you set a target value, you can display the target value line on the graph.
Target values can be set from the settings screen that appears when you click the settings button.
(Point group/usage target value setting screen)
display
Check the target values you want to display.
Target Title
Specify a title for the goal.
format
line
The target value is displayed as a line.
area
The target value is displayed as an area.
color
Set the display color for the target value. Double-click to display the color palette and select the display color.
Line Weight
Specifies the line thickness when displaying the target value in line format.
Transparency
Specify the transparency of the target value when it is displayed as a percentage. When displaying an area, you can adjust the visibility of the graph by setting the fill to a lighter color.
Front display
Check this box to display the target value in front of the graph.
How to enter target values
You can choose how to enter the target value.
Direct input
Enter numbers directly into the usage goal setting grid.
tag
You can assign tags to your usage goal settings. When you select "Tags", a tag selection button will appear in the grid. You can select tags from the selection screen that appears when you click the tag selection button.
By assigning a tag to a target value, you can dynamically change the target value depending on the tag value.
Usage target setting
You can set target usage values for point groups by hour (day display), day (month display), month (year display), or year (multi-year display).
By clicking the calculation button at the bottom of the usage goal settings, you can easily calculate the following values based on your input.
H*24
Set your daily target value as 24 times your hourly target value.
D*31
Set your monthly goal as 31 times your daily goal.
M*12
Set your annual target value as 12 times your monthly target value.
Maximum display value
You can set the maximum display value for the point group usage for each hour (day display)/day (month display)/month (year display)/year (multi-year display). This setting is referenced when displaying the usage graph. If left blank, it will be processed automatically.
By clicking the calculation button at the bottom of the display maximum value setting, you can easily calculate the following values based on the input.
H*24
The daily target value will be set to 24 times the hourly target value of the maximum usage display setting.
D*31
Set your monthly goal as 31 times your daily goal.
M*12
Set your annual target value as 12 times your monthly target value.
Display minimum value
You can set the minimum display value of the graph group usage for each hour (day display) / day (month display) / month (year display) / year (multi-year display). This setting is referenced when displaying the usage graph. If it is blank, it will be processed automatically.
By clicking the Calculation button at the bottom of the Minimum Display Value setting, you can easily calculate the following values based on your input.
H*24
The daily target value is set to 24 times the hourly target value of the minimum usage display setting.
D*31
Set your monthly goal as 31 times your daily goal.
M*12
Set your annual target value as 12 times your monthly target value.
3
Conversion graph settings
Configure the settings for the conversion graph.
Heat conversion
Select the energy type when converting the amount of energy used into heat.
CO2 equivalent
Select the energy type when converting the amount of energy used into CO2.
Crude oil equivalent
Select the energy type when converting calorific value into crude oil.
Day/night coefficient adopted
Set whether to use the daytime or nighttime conversion coefficient.
4
Comparison Graph Settings
Configure the settings for graph comparison display.
Series 1 color
Sets the color of series 1 in the comparison graph.
Series 2 colors
Sets the color of series 2 in the comparison graph.
Series 3 colors
Sets the color of series 3 in the comparison graph.
5
Point Operation
addition
Adds a point to the point group being edited.
delete
Removes a point from the point group being edited.
Up/Down
Moves the display order of the selected point.
6
Points list
Data Source
Specifies the data source of the points you want to add to the point group.
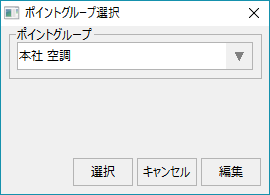
Click the button below to display the data source selection screen.
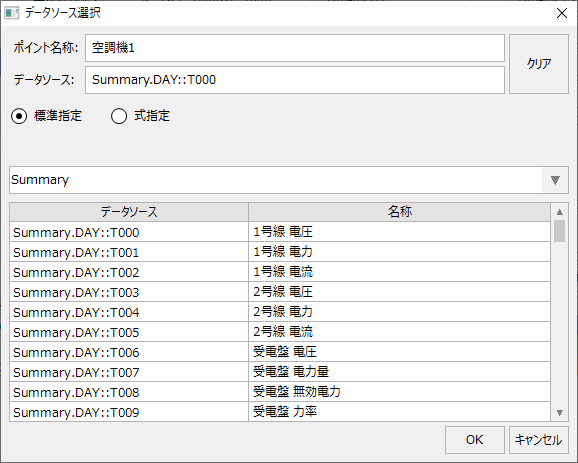
(Data source selection screen)
On the data source selection screen, select the desired data source from the list of data sources.
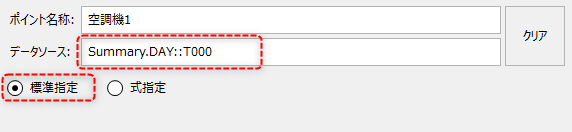
If you select "Standard specification", specify the data source name selected from the data source list.
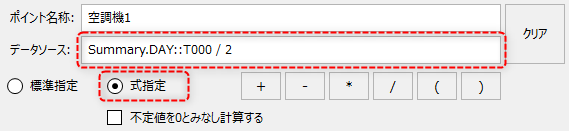
If you select "Specify expression", you can specify the calculation expression for the data source. You can also calculate multiple data sources together.
If you check "Calculate assuming undefined values as 0", if the data source in the calculation formula is an undefined value (a value that cannot be obtained due to a communication failure, etc.), the calculation will treat it as 0.
Point name
Specify the name of the point.
color
Set the color in which the relevant point will be displayed on the usage graph.
format
Select how to display the points on the usage graph. You can choose from "Bar", "Line" or "Area".
Only data sources with "Bar" selected as the format will be displayed as layers.
bar
Shown as a bar graph.
line
Shown as a line graph.
area
Displays in area view (filled view).
7
keep/
Cancel
keep
Saves the current edits and closes the settings screen.
cancel
Cancels and closes the current edits.
Measurement point registration screen
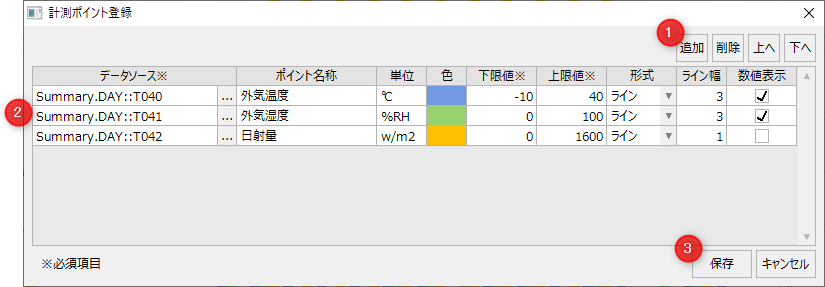
This is the setting screen for registering the measurement points you want to display overlaid on the graph.
#
name
explanation
1
Measurement point operation
addition
Add a measurement point.
delete
Delete the measurement point.
Up/Down
Change the display order of measurement points.
2
Measurement points list
Data Source
Specify the data source of the measurement point you want to overlay on the graph.
Click the button below to display the data source selection screen.
(Data source selection screen)
Point name
Set the name of the measurement point.
unit
Set the units.
Lower limit/Upper limit
Set the display range (lower limit, upper limit) for displaying measurement values on a graph.
format
Select the display method for the measurement values on the graph. You can choose either "Line" or "Area".
Line Width
Sets the width of the line when displayed.
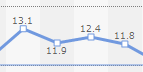
Numerical display
Set whether or not to display numerical values on the graph.
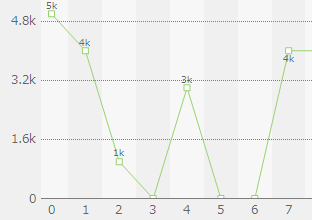
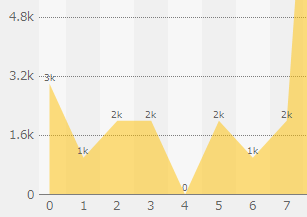
(Numeric display)
(Numbers not displayed)
3
keep/
Cancel
keep
Saves the current edits and closes the settings screen.
cancel
Cancels and closes the current edits.
Coefficient registration screen
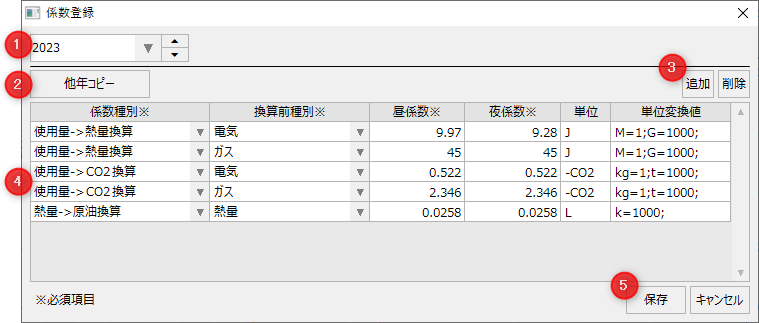
This is the settings screen for registering conversion coefficients.
#
name
explanation
1
Year Selection
Select the year for which you want to register the coefficient. If you select the most recently registered year and click "▲", a new year will be added.
When displaying the energy management graph, it is also possible to display it in so-called "fiscal" units.
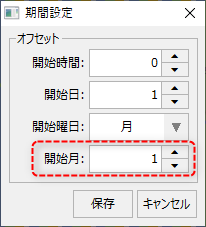
The start month of the year can be changed from the period setting screen.
(Period setting screen)
When displaying the conversion graph, the month specified in "Start month" on the left will be used as the start month of the year and the conversion coefficient will be used.
For example, if you want to start in April, enter "4" as the start month.
2
Other year copies
You can copy and use data from other years.
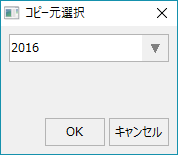
When you click the "Copy other years" button, the following selection screen will be displayed. Select the year to copy from on the screen and click the "OK" button, and the data from the source year will be copied to the year you are currently editing.
3
Coefficient Operations
addition
Add a new coefficient.
delete
Deletes the selected coefficient from the list.
4
Coefficients list
Coefficient Type
Select the type of coefficient to convert.
Amount used -> Heat conversion
Register the coefficients for converting the amount of electricity, gas, etc. used into heat.
Amount used - >CO2 equivalent
Register the coefficients for converting electricity, gas, etc. usage into CO2.
Calorific value -> Crude oil equivalent
Register the coefficient for converting calorific value to crude oil value.
Before conversion type
Select the energy type before conversion.
Daytime factor
Set the daytime conversion factor.
Night Coefficient
Set the nighttime conversion factor.
unit
Set the unit after conversion.
Unit Conversion Values
Set this when performing automatic unit conversion in the energy management graph. Specify the conversion string to be added to the unit along with the number of conversion digits. Specify the automatic conversion digit information separated by a ";" (half-width semicolon).
Example: Heat conversion
Set "M=1;G1000". Specify "J" as the unit.
1MJ is converted to 1GJ, and 1000MJ is converted to 1GJ.
5
keep/
Cancel
keep
Saves the current edits and closes the settings screen.
cancel
Cancels and closes the current edits.
Energy type registration screen
This is the settings screen for registering energy types.
#
name
explanation
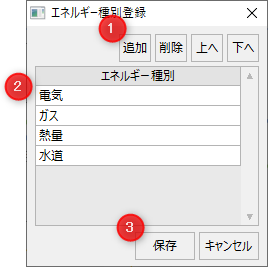
1
Energy Type Control
addition
Add an energy type.
delete
Delete the energy type.
Up/Down
Change the display order of energy types.
2
Energy Type List
Energy type name
Set the name of the energy type.
3
keep/
Cancel
keep
Saves the current edits and closes the settings screen.
cancel
Cancels and closes the current edits.
Display settings screen
This screen is used to configure various display settings for the energy management screen.
#
name
explanation
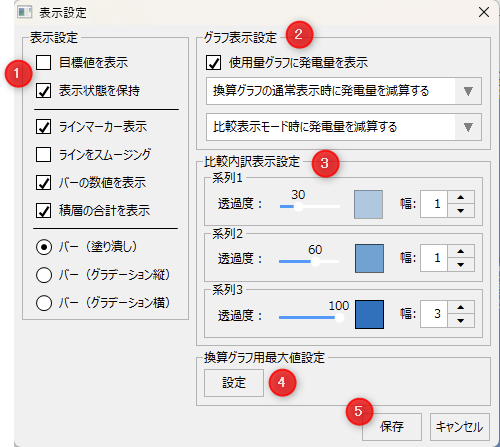
1
Display settings
Display target value
Shows or hides the target value on the graph.
Maintain Visibility
If you check this setting, the settings changed on the screen will be retained. The settings are saved for each client.
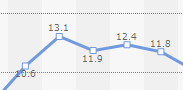
Line marker display
Toggles the display of measurement point graph markers on and off.
(Marker display)
(marker not shown)
Smoothing Lines
Switches whether or not to display the measurement point lines in a smooth manner.
(with smoothing)
(No smoothing)
Show bar values
When enabled, numbers are displayed on the bar graph.
Even if this setting is enabled, if the graph width is too narrow to display numerical values, it will be automatically hidden.
Show stack totals
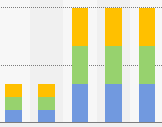
When enabled, the total value will be displayed at the top of the bar graph.
Bar (filled)
Displays the bar fill as a solid color.
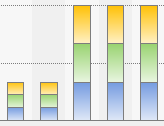
Bar (vertical gradation)
Displays the bar fill as a vertical gradient.
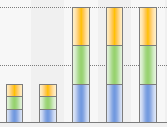
Bar (Horizontal Gradient)
Displays the bar fill as a horizontal gradient.
2
Graph display settings
Display power generation amount on usage graph
If you uncheck this setting, the data of the point groups registered in the graph group, for which the amount of power generation is set in the "Consumption/Power Generation" setting, will be excluded from the display of the usage graph. However, if the graph display method is set to "Power generation/Consumption", the contents of this setting will be ignored and the amount of power generation will also be displayed on the graph.
If you turn this setting off, the amount of electricity generated (energy creation) will be excluded from the data displayed in the usage graph. If you want to display only consumption data in the usage graph, uncheck this setting.
Setting the power generation amount for normal display of the conversion graph
Select how to handle the amount of power generation during normal display (when no display mode is selected) in the energy conversion graph, CO2 conversion graph, and crude oil conversion graph.
Subtracting the amount of power generated when the conversion graph is displayed normally
A conversion graph is displayed with the total amount of electricity consumed minus the total amount of electricity generated.
Exclude power generation amount when normal display of conversion graph
The amount of electricity generated is excluded from the amount of electricity consumed, and the conversion graph shows the total amount of electricity consumed only.
Include power generation amount in normal display of conversion graph
The amount of electricity generated is included in the total amount of electricity consumed, without making a distinction between the amount of electricity generated and the amount of electricity consumed, and is displayed as a conversion graph.
Setting the power generation amount in comparison display mode
Select how to handle the amount of power generated when displaying the comparison display mode in the usage graph, energy conversion graph, CO2 conversion graph, and crude oil conversion graph.
Subtract power generation amount in comparison display mode
The comparison is displayed by subtracting the total power generation from the total consumption.
Exclude power generation amount in comparison display mode
The amount of electricity generated is excluded from the comparison display, and only the total amount of electricity consumed is displayed for comparison.
Include power generation amount in comparison display mode
The amount of electricity generated is included in the total amount of electricity consumed for comparison, without making a distinction between the amount of electricity generated and the amount of electricity consumed.
3
Comparison details display settings
In the comparison breakdown display of a graph, you can specify the transparency and width for each series.
Transparency
You can specify the transparency of the graph as a percentage.
width
You can specify the graph width numerically.
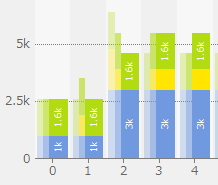
For example, when comparing data in a usage graph, if you want to show data from two years ago in series 1, data from one year ago in series 2, and the most recent data in series 3, you can make the most recent data easier to see by setting the width of series 1 and 2 to 1, and the width of series 3 to 3.
4
Maximum value setting for conversion graph
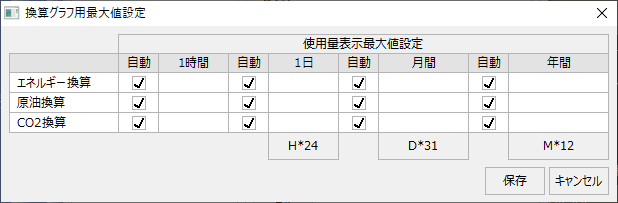
Clicking the Settings button will display the maximum value setting screen for the conversion graph.
From this setting screen, you can specify the maximum value of the graph when displaying various conversion graphs. If left blank, it will be processed automatically.
(Maximum value setting screen for conversion graph)
If you uncheck Automatic, you can enter values freely.
If you check Auto, the calculation will be done automatically based on the data you want to display. Even if Auto is not checked, if the input box is blank, it will be treated as automatic.
5
keep/
Cancel
keep
Saves the current edits and closes the settings screen.
cancel
Cancels and closes the current edits.
Period setting screen
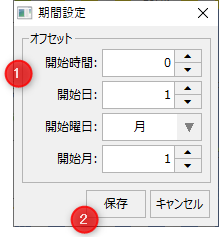
This is the setting screen for the period on the Energy Management screen.
#
name
explanation
1
Setting the offset
Start time
Specify the start time of the graph when the graph period is set to "Day".
start date
Specify the start date of the graph when the graph period is set to "Month".
Start day
Specify the start day of the week for the graph when the graph period is set to "week".
Start month
Specify the start month of the graph when the graph period is set to "year".
In addition, when displaying the conversion graph, the conversion factor will be used with the month specified here as the start month of the year.
For example, if you want to start in April, enter "4" as the start month.
2
keep/
Cancel
keep
Saves the current edits and closes the settings screen.
cancel
Cancels and closes the current edits.
Multiple point display selection screen
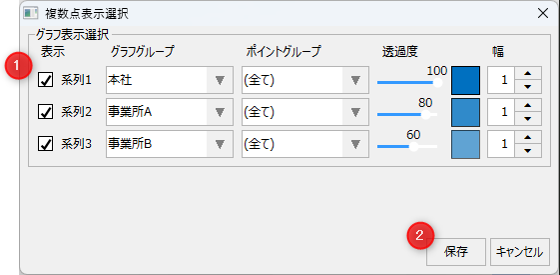
This is the setting screen for selecting the graph groups and point groups to be compared when comparing multiple points.
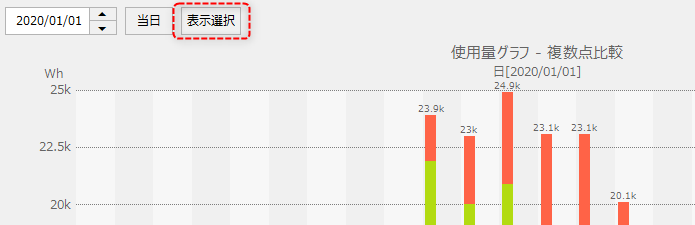
This settings screen can be called up from the "Display Selection" button that appears to the right of the date when comparing multiple points on various graphs.
#
name
explanation
1
Graph display selection
You can set up to three groups for multiple comparison.
display
Set whether to show or hide the series.
Graph Group
Select the graph group to assign to the series.
Point Groups
Select the point group contained in the graph group. If you select "All", all point groups contained in the graph group will be displayed.
Transparency
You can specify the transparency of the graph as a percentage.
width
You can specify the graph width numerically.
2
keep/
Cancel
keep
Saves the current edits and closes the settings screen.