overview
The demand history screen is used to display the demand history graph (demand curve graph). The demand power history in 30-minute intervals can be displayed on a bar graph.
This screen is displayed by connecting to a summary action prepared specifically for demand function aggregation, separate from the summary action for normal daily report aggregation. In the standard project, a summary action called "DemandSummary" is registered and is set to log and aggregate demand power in 30-minute intervals.
(Demand history screen)
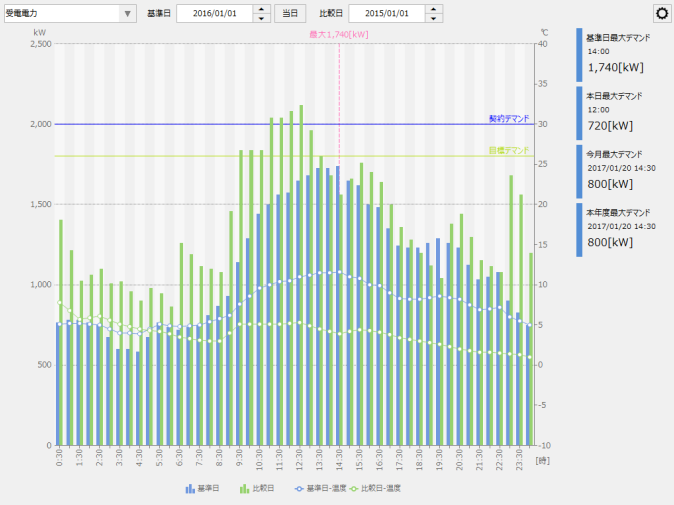
The following explains how to operate the demand monitoring screen.
|
For details about the display items on the Demand History screen, see "Demand History" in the screen library. |

Demand history screen operation
This section explains how to operate the demand history screen.
■ Demand monitoring selection operation
Select the demand monitoring target from the combo box below. If multiple demand monitors (demand actions) are registered, you can select and switch between them from here.

■Selection of base date/comparison date
Select the base date and comparison date to be displayed on the demand history screen from the following.

If you select "Today" as the base date, data for that day will be displayed.
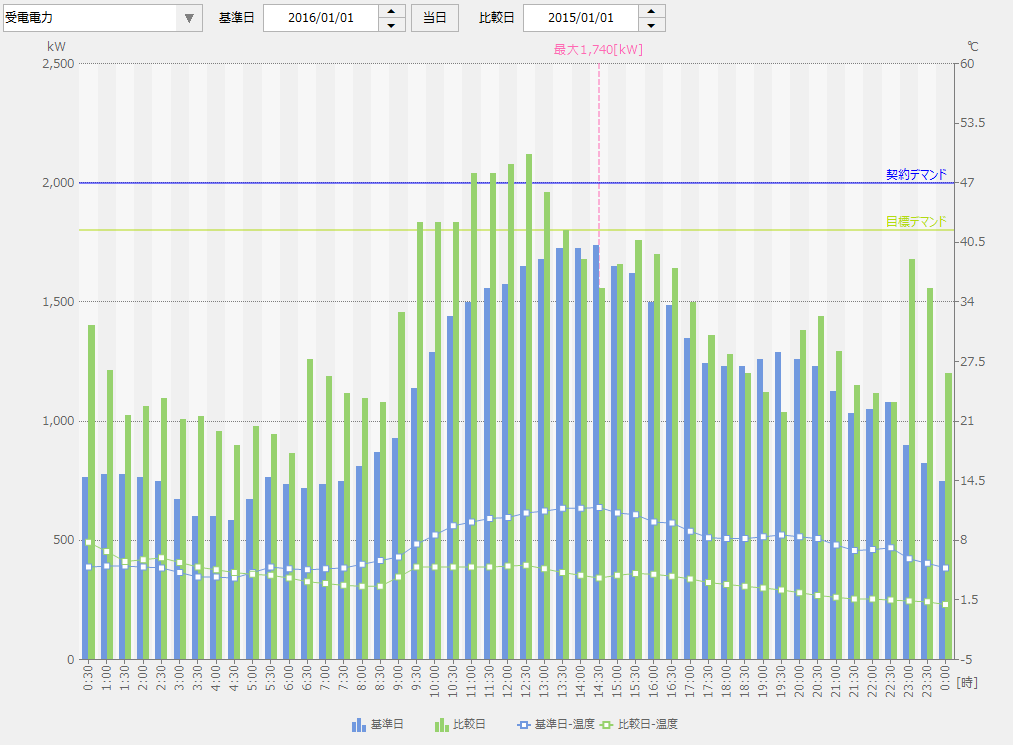
By specifying a comparison date, you can display the demand history for the base date and the comparison date side by side on a graph.
Below is an example showing the base date and comparison date side by side.
■ Show/hide the graph (legend operation)
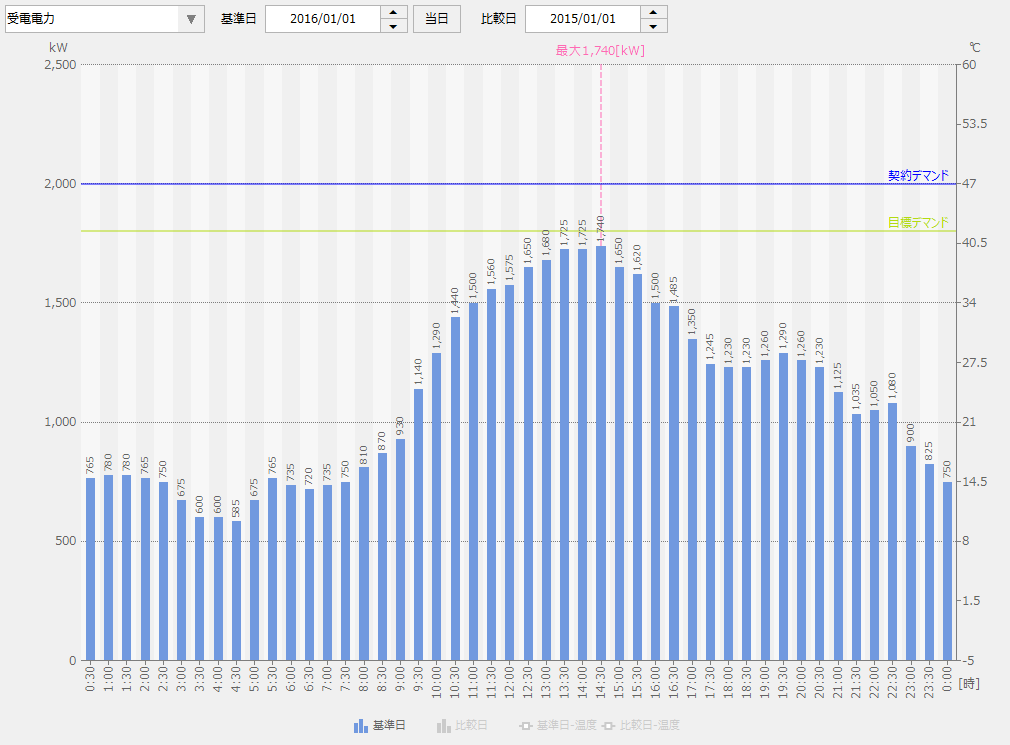
The following legend is displayed at the bottom of the graph. Clicking the legend will allow you to show/hide the series displayed on the graph.
Chart series that are currently hidden will appear in the legend in light grey.

Below is an example where the comparison date is hidden.
■ Show/hide the settings menu
|
Click the settings icon (gear) displayed in the upper right corner of the demand history screen to show/hide the settings menu.
Various operations on the demand history screen are performed from this menu.
|
■ Setting the graph period
|
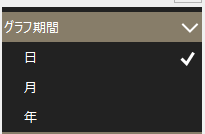
You can change the display period on the demand history screen in units of Daily/Monthly/Yearly Report.
|
■ Display settings
|
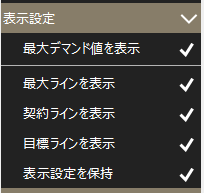
Configure the display settings for the demand history screen.
From the menu on the left, you can toggle between displaying/hiding maximum demand, maximum line, contract line, and target line.
Also, if you check "Keep display settings", the above display settings will be saved, and the next time you view the demand history screen, it will be displayed with the previous settings.
|
■ Measurement point registration
|
By registering measurement points, you can display historical measurement data in a line graph overlaid on the demand history screen.
|
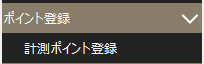
This setting is done from the measurement point registration dialog.
(Measurement point registration dialog)
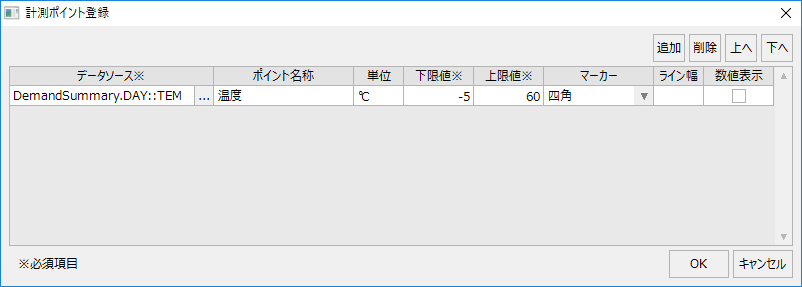
For the data source, you can select from the fields registered in the summary action for logging and aggregating demand history (the "DemandSummary" action in a standard project).
After selecting the data source, set the point name, unit, lower limit, upper limit, marker, etc. in the grid on the setting screen. In particular, the lower limit and upper limit settings are required and must be specified. The lower limit and upper limit set here will be the Y-axis range when displaying a graph of the measurement values, with the lower limit displayed as 0% of the graph area and the upper limit displayed as 100% of the graph area. You can also select from squares, triangles, etc. as the graph marker. The marker specified here will be used as the marker for the points displayed in the line graph on the demand history screen.
|
To display a measurement point, the tag of the desired measurement value must be registered as a field in the summary action settings for demand history. For details on registering a measurement value field, see "Demand History Settings (Tag Field Master)". |
■ Printing
|
By selecting Print, you can print the screen image (hard copy of the screen) currently displayed on the Demand History screen.
Additionally, by using CSV output, the currently displayed data can be saved to a CSV file.
|