Energy management grouping concept
In order to display the metering data collected from equipment as an energy management graph, it is necessary to summarize it into easy-to-understand units for analyzing and understanding the energy usage status of the monitored equipment. For example, various groups are possible, such as by floor, by building, by contract tenant, or by type of energy such as electricity, gas, or heavy oil. Summarizing metering data into easy-to-understand units is called "grouping" here. In order to display a graph on the energy management screen, it is first necessary to group each metering information as an initial setting. From the graph screen, you can display the desired graph by specifying the date conditions and target group you want to display.
There are two concepts for grouping on the energy management screen: "point groups" and "graph groups."
group |
Commentary |
Point Groups |
One or more "metering points" of the same energy type are grouped by management unit, such as by floor, tenant, or type of equipment. Here, a metering point refers to the field of each usage amount that is aggregated as metering data. For example, when aggregating power amounts using a summary action, you can set it to log and aggregate the integrated ring counter taken from the power meter's pulse counter, and specify the data source name for obtaining the integrated value when specifying the metering point.
A weighing point can be registered in multiple point groups. You can also distribute the apportioned values of a weighing point among multiple point groups.
example) Head office electricity amount, Office A electricity amount, Office B electricity amount... Head office air-conditioning power, Head office lighting power, Office A air-conditioning power, Office A lighting power, Office B air-conditioning power, Office B lighting power... 1F electric energy, 2F electric energy... Gas volume at head office, gas volume at 1F, gas volume at 2F, gas volume at business site A, gas volume at business site B... Tenant A's power consumption, Tenant B's power consumption...
|
Graph Group |
Further group one or more point groups by management unit, such as the entire office, the entire floor, the entire facility, Western Japan, Eastern Japan, or department.
A point group can be registered in multiple graph groups. You can also allocate points proportionally across groups.
Example 1) When aggregating all types of energy amounts for each head office/office Company-wide: Head office electricity volume, Head office gas volume, Business office A electricity volume, Business office A gas volume, Business office B electricity volume, Business office B gas volume Head office: Head office air conditioning power consumption, Head office lighting power consumption, Head office gas consumption Business site A: Electricity consumption at business site A, gas consumption at business site A Business location B: Electricity consumption at business location B, gas consumption at business location B
Example 2) When tabulating by energy type for each head office/office Company-wide power: Head office power consumption, business office A power consumption, business office B power consumption Head office power: Head office air conditioning power consumption, Head office lighting power consumption Business site A power: Business site A air conditioning power consumption, Business site A lighting power consumption Office B electricity... Office B air conditioning power, Office B lighting power Company-wide gas: Head office gas volume, business office A gas volume, business office B gas volume Headquarters gas: Headquarters gas volume Business A Gas...Business A Gas Volume Business B gas...Business B gas volume
|
Below is a conceptual diagram of grouping.
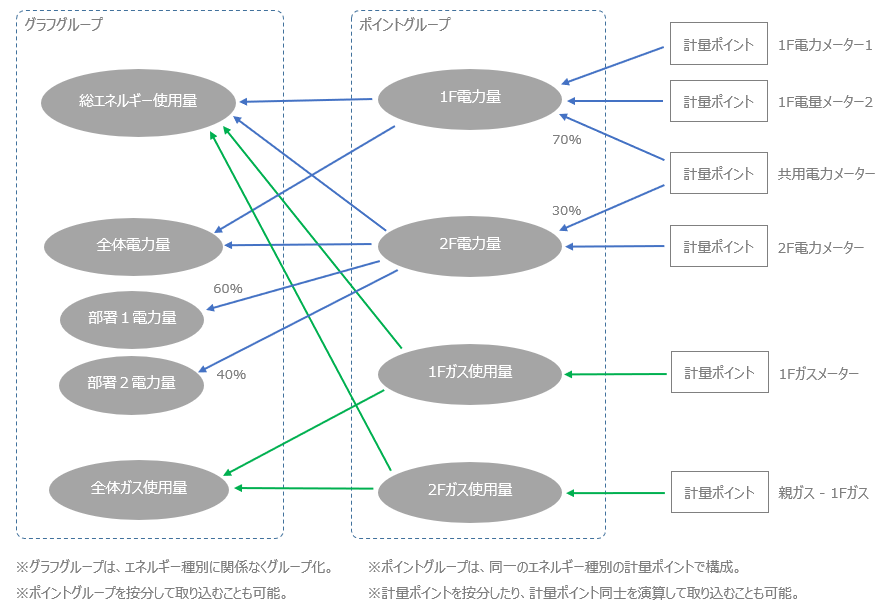
|
If you would like to know specific examples of grouping settings and their relationship to the graph display, please refer to "Energy Management in Practice". |
