overview
The energy management function is a function for displaying energy management graphs based on measurement aggregation data (aggregated data from Daily/Monthly/Yearly Report) such as the amount of electricity and gas usage.
(Energy management screen: usage graph)
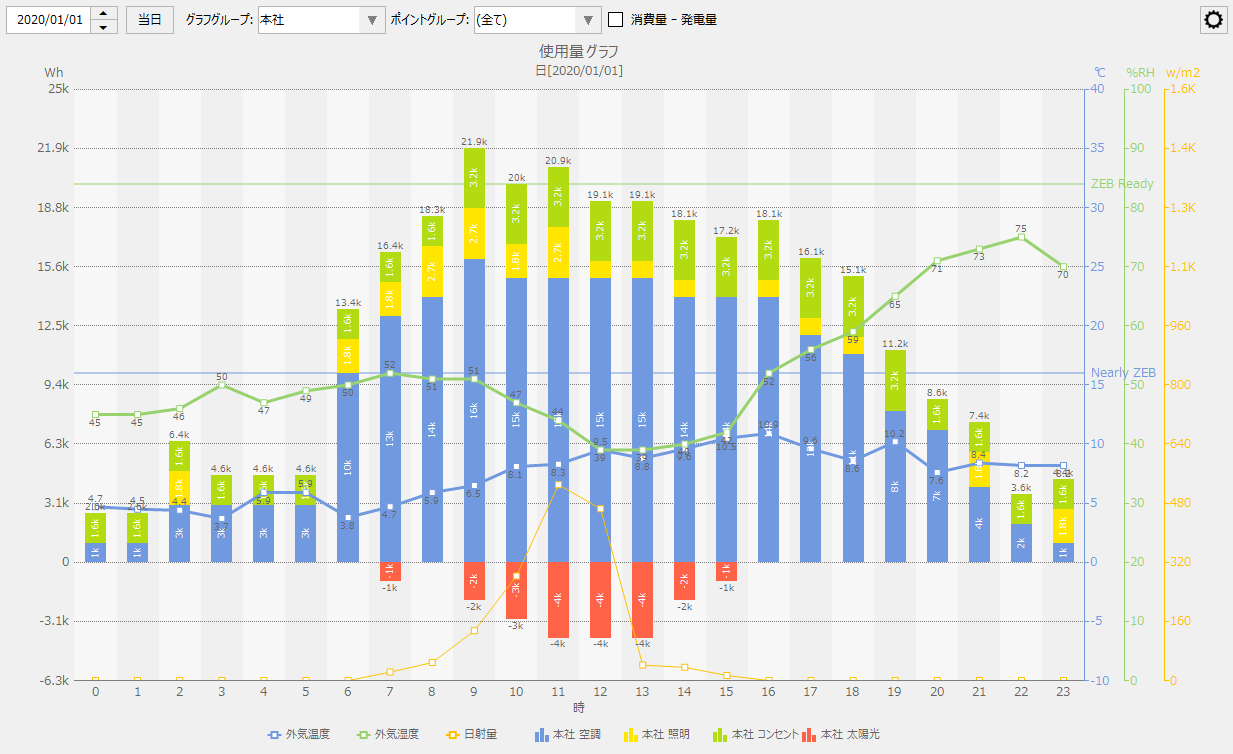
In addition to displaying metric data such as electricity and gas usage as usage graphs based on the specified date and period (daily, weekly, monthly, yearly, multi-year) requested from the screen, you can also display graphs of CO2 conversion, crude oil conversion, and energy conversion by registering conversion factors for various types of energy. You can also overlay any measurement data such as outside temperature and humidity on the graph, compare specified periods on the graph, print the displayed graph, and save the displayed data to a CSV file.
The basic concepts of energy management are explained below.
content |
overview |
Energy management graph types and display methods
|
This section provides a brief explanation of the types of graphs that can be displayed on the energy management screen and how to display them. |
About the Energy Management Screen Library
|
A brief explanation of the Energy Management Screen Library. |
Relationship between energy management and server functions
|
This section explains the relationship between the energy management screen library and each action on the server side. |
Energy types and conversion process
|
This section explains energy types and conversion processes, which are important concepts required for energy management. |
|
|
This section explains the point groups and graph groups required to display graphs on the energy management screen. |
Aggregated data that can be handled through energy management
|
This section explains the specifications for the aggregation data that can be handled by energy management. |