There are three concepts for displaying energy management graphs: "graph type," "display method," and "display mode." By combining these options, you can display a variety of graphs.
First, the graph type is the type of graph that can be displayed. The graph types available are "Usage graph," "Energy conversion graph," "Crude oil conversion graph," "CO2 conversion graph," and "Ranking graph."
The available display methods are "grouped bar," "stacked bar," "100% stacked," "circle," and "power generation/consumption." Each of the above graph types can be freely switched from the screen.
In addition, the following display modes are available: "Comparison display," "Comparison breakdown display," "Multiple item comparison display," and "Cumulative display."
The following explains each graph type, how to display it, and the display mode.
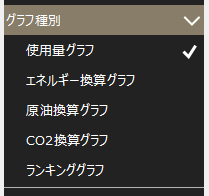
First, energy management graphs are broadly categorized by "graph type." The available graph types are "usage graph," "energy conversion graph," "crude oil conversion graph," "CO2 conversion graph," and "ranking graph."
You can switch graph types from the settings menu.
Graph Type |
explanation |
Screen image |
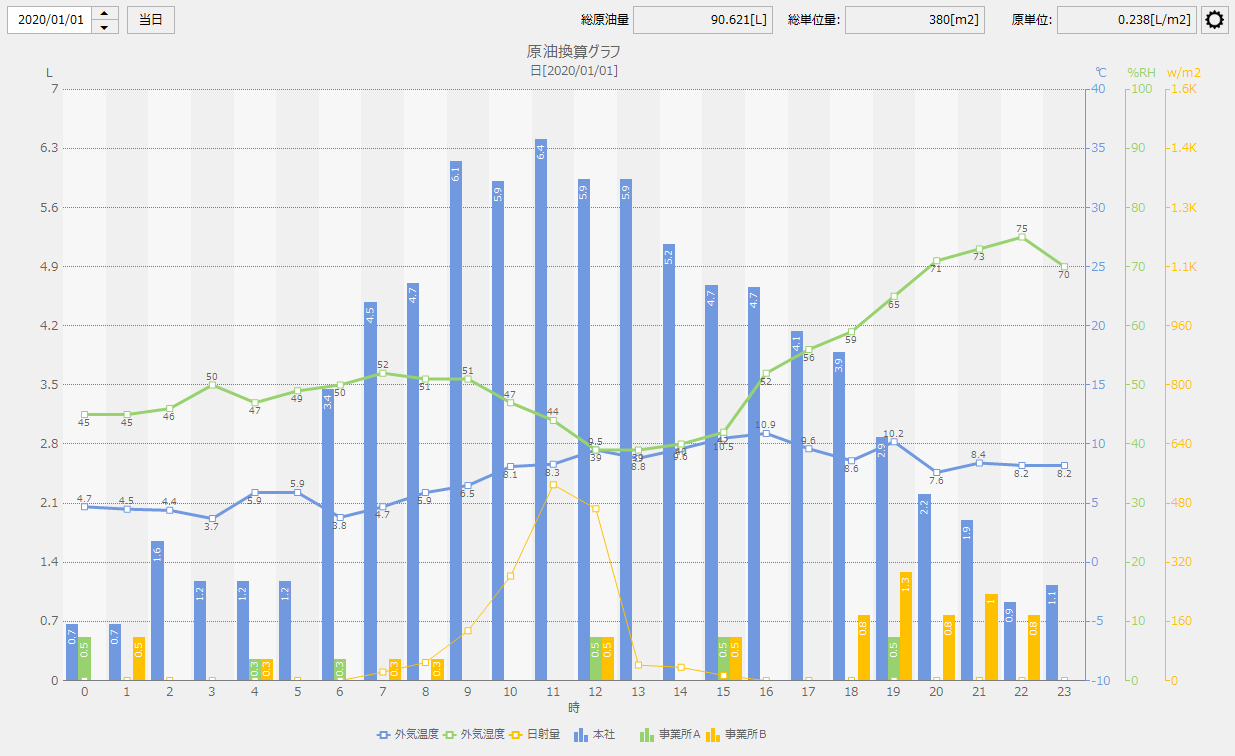
Usage graph |
Displays the usage of electricity, gas, etc. in a graph. |
|
Energy Conversion Chart |
The amount of each type of usage is converted into heat (J (Joules)) and displayed in a graph. |
|
CO2 conversion graph |
The amount of each type of usage is converted into CO2 and displayed in a graph. |
|
Crude oil conversion chart |
The energy converted data is then converted further into crude oil and displayed in a graph. |
|
Ranking Graph |
Usage is displayed in ranking format for each graph group. |
|
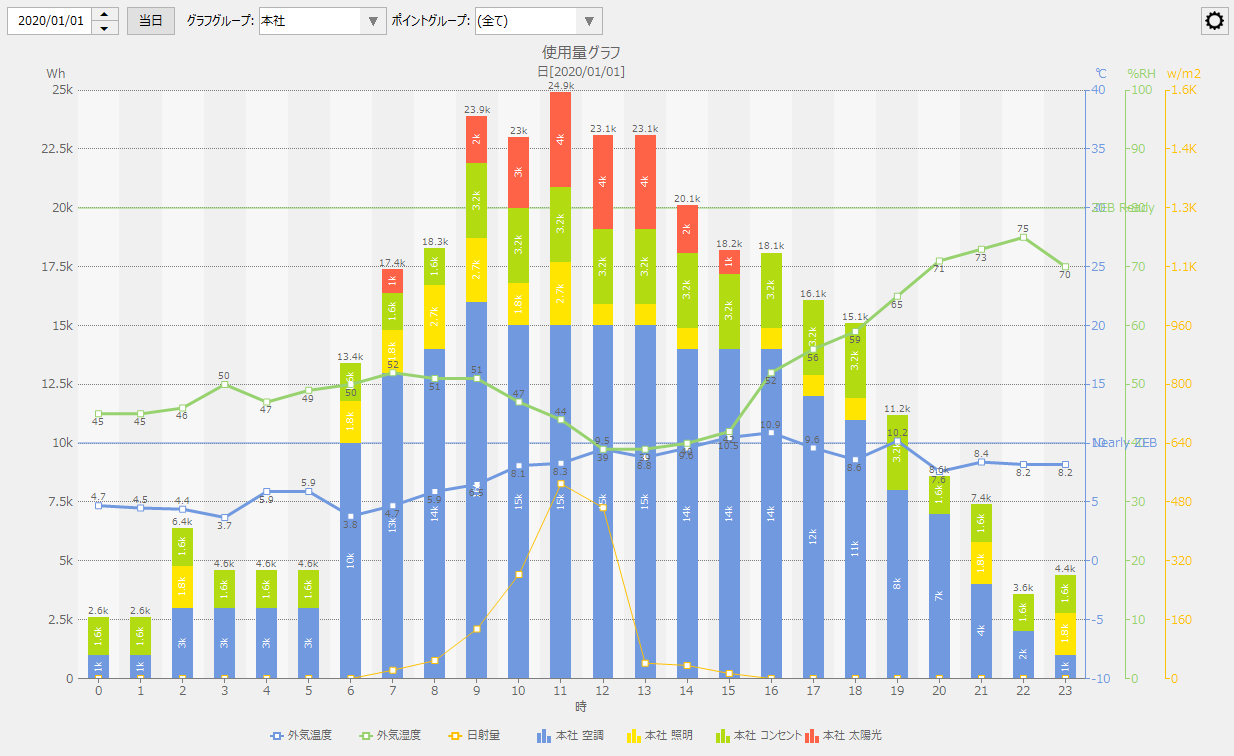
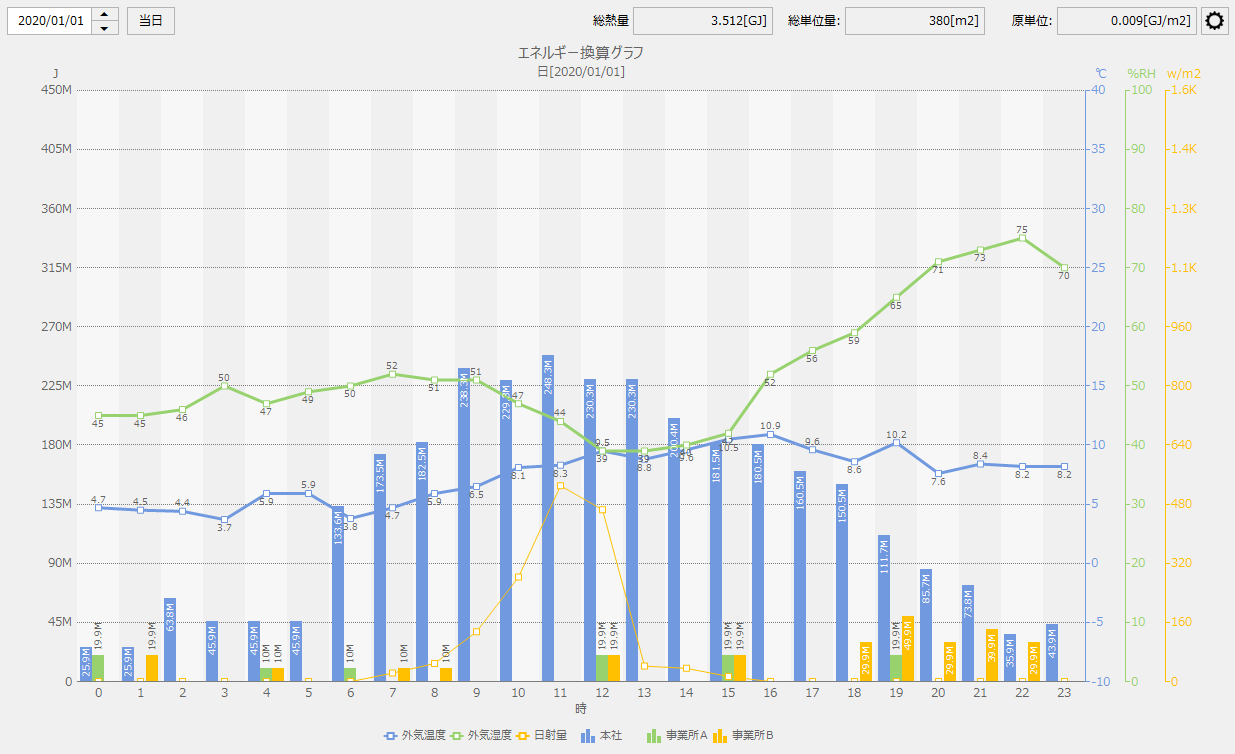
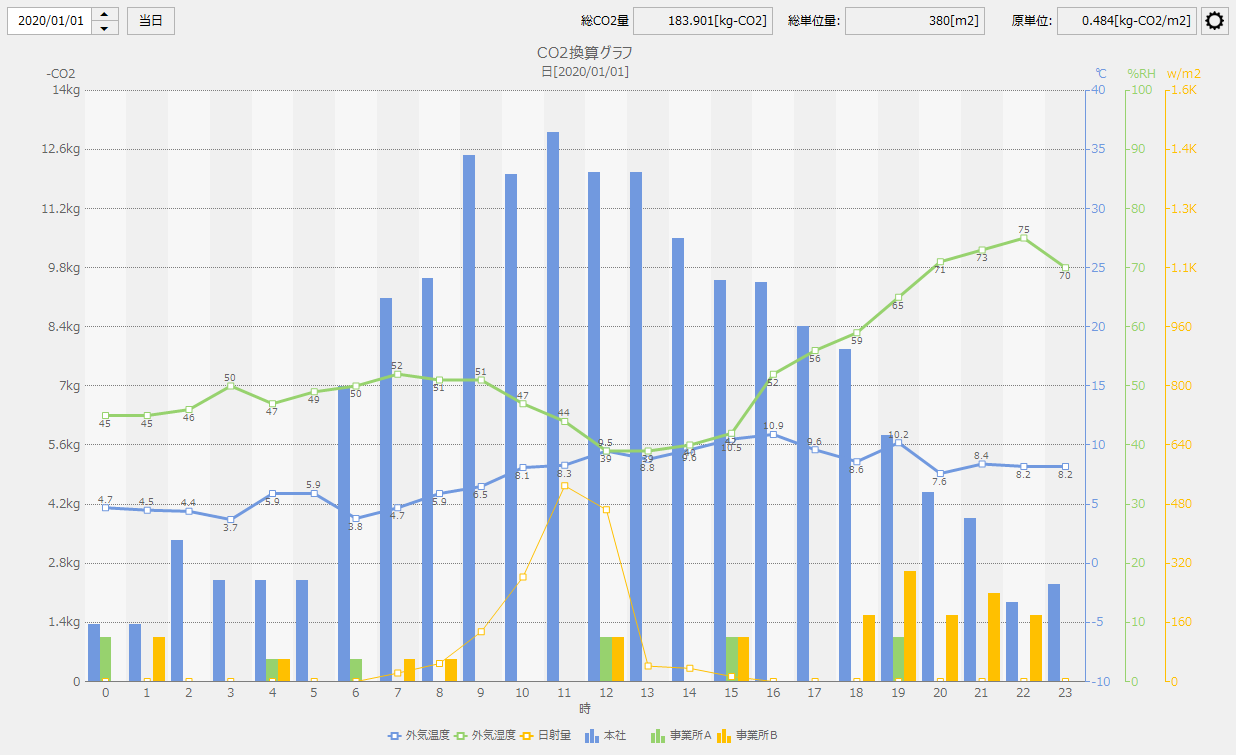
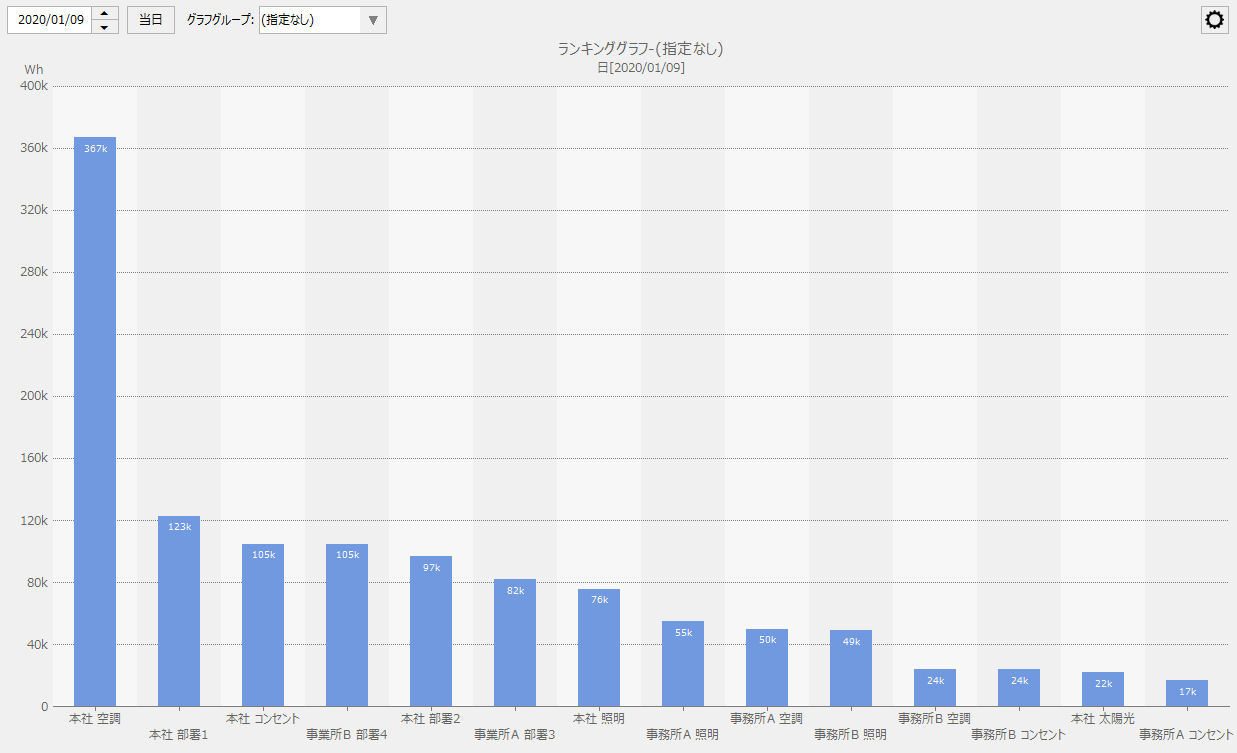
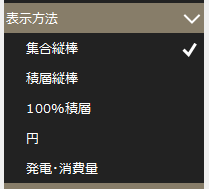
The graph display methods available are "Grouped Bar", "Stacked Bar", "100% Stacked", "Pie", and "Power Generation/Consumption". Of the graph types, "Ranking Graph" only supports "Grouped Bar". For other graph types, you can switch the graph display by specifying each display method.
You can switch the display method from the settings menu.
How to display the graph |
explanation |
Screen image |
||
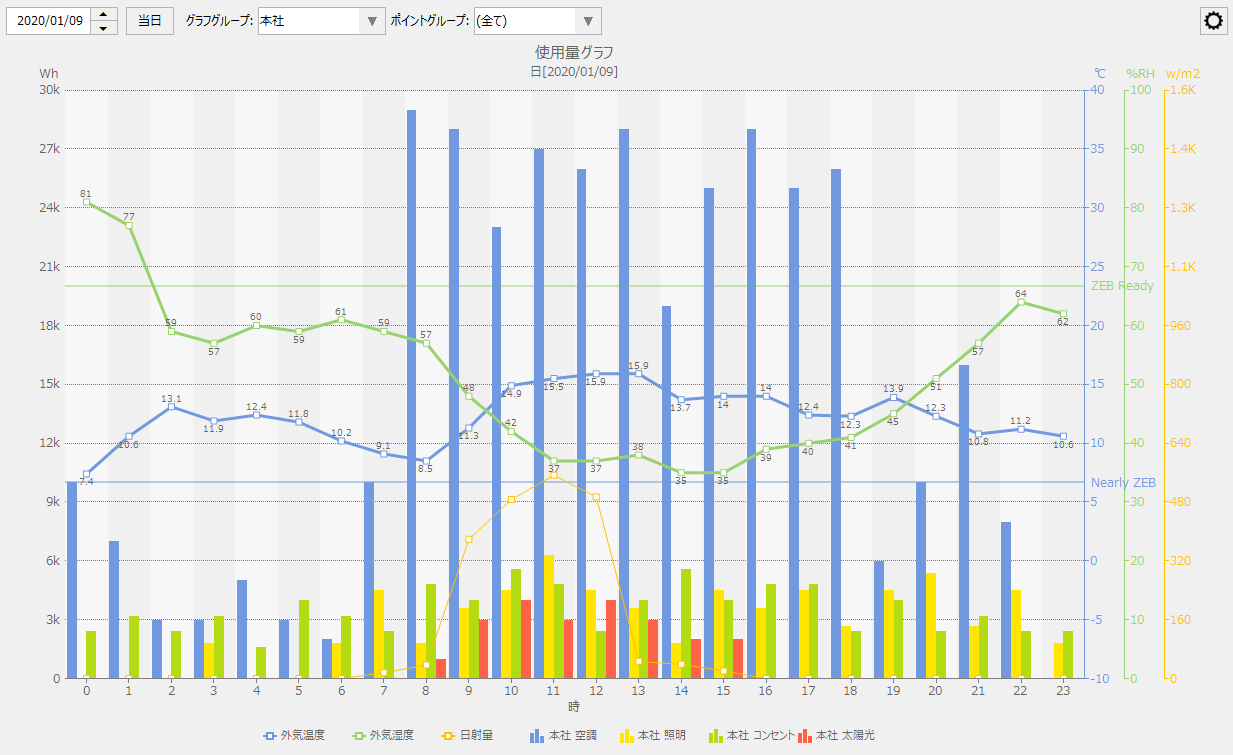
Clustered Vertical Bar |
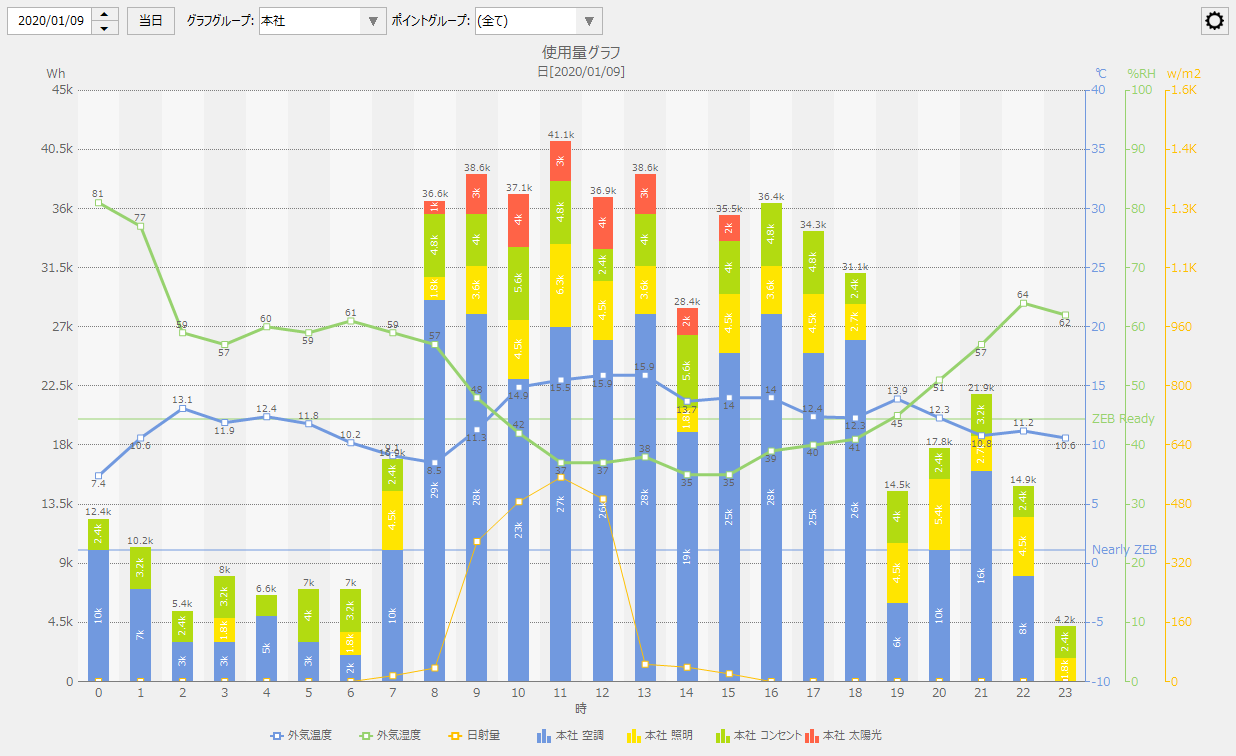
The totals for each aggregation unit based on the group settings are calculated, and multiple bar graphs with the same display time unit are bundled and displayed.
For example, in the case of a daily report, the totals for each aggregation unit are displayed as a set of bar graphs, each with an hourly scale on the horizontal axis.
On the right is an example of a usage graph displayed as a grouped bar.
|
|
||
Stacked Vertical Bars |
Displays a collection of the above bar graphs as a single stacked bar graph.
|
|
||
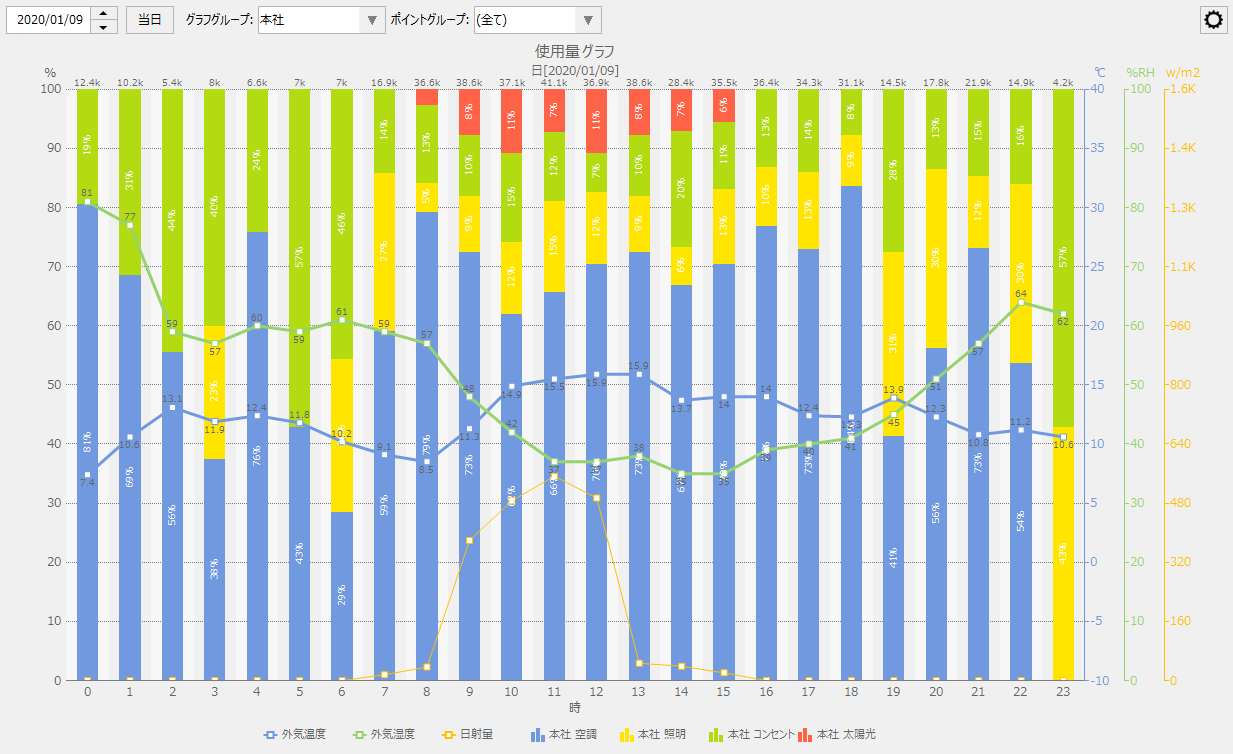
100% Laminated |
Displays stacked bar graphs with the height converted to 100%.
|
|
||
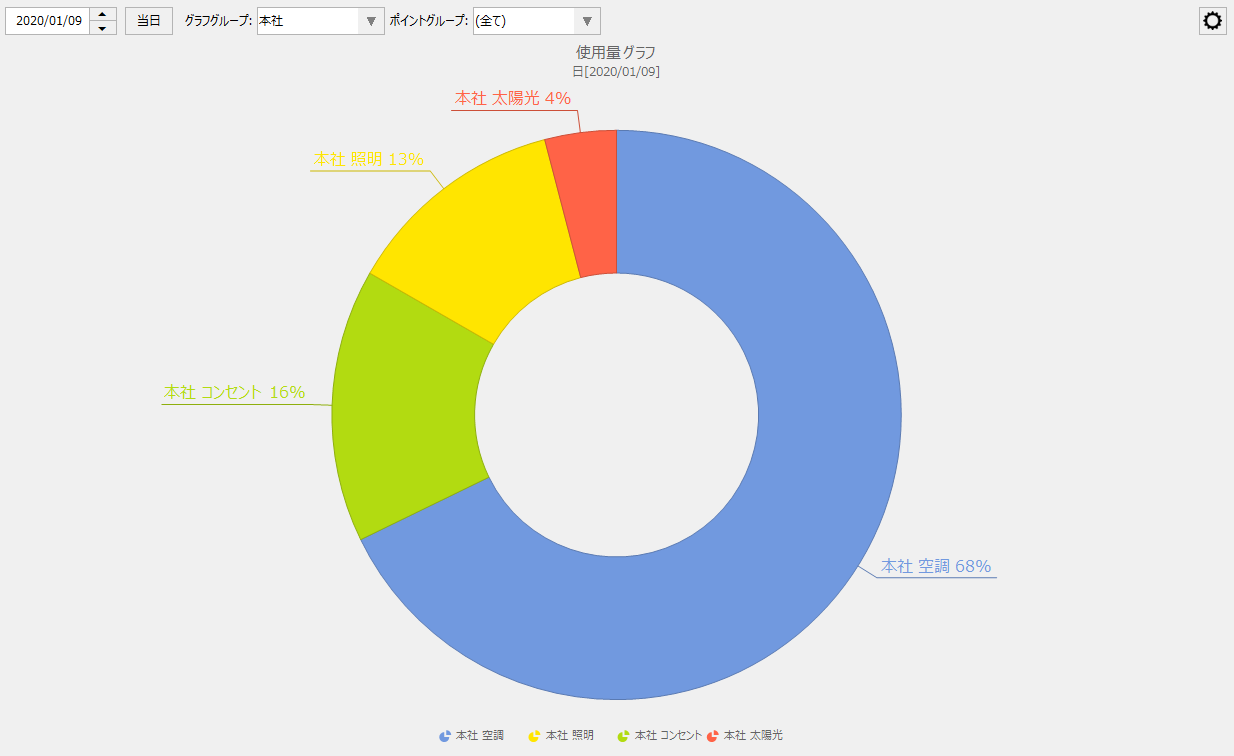
circle |
Subtotals for the display period are calculated for each aggregation unit based on the group settings, and the total is displayed as a pie chart with 100%.
|
|
||
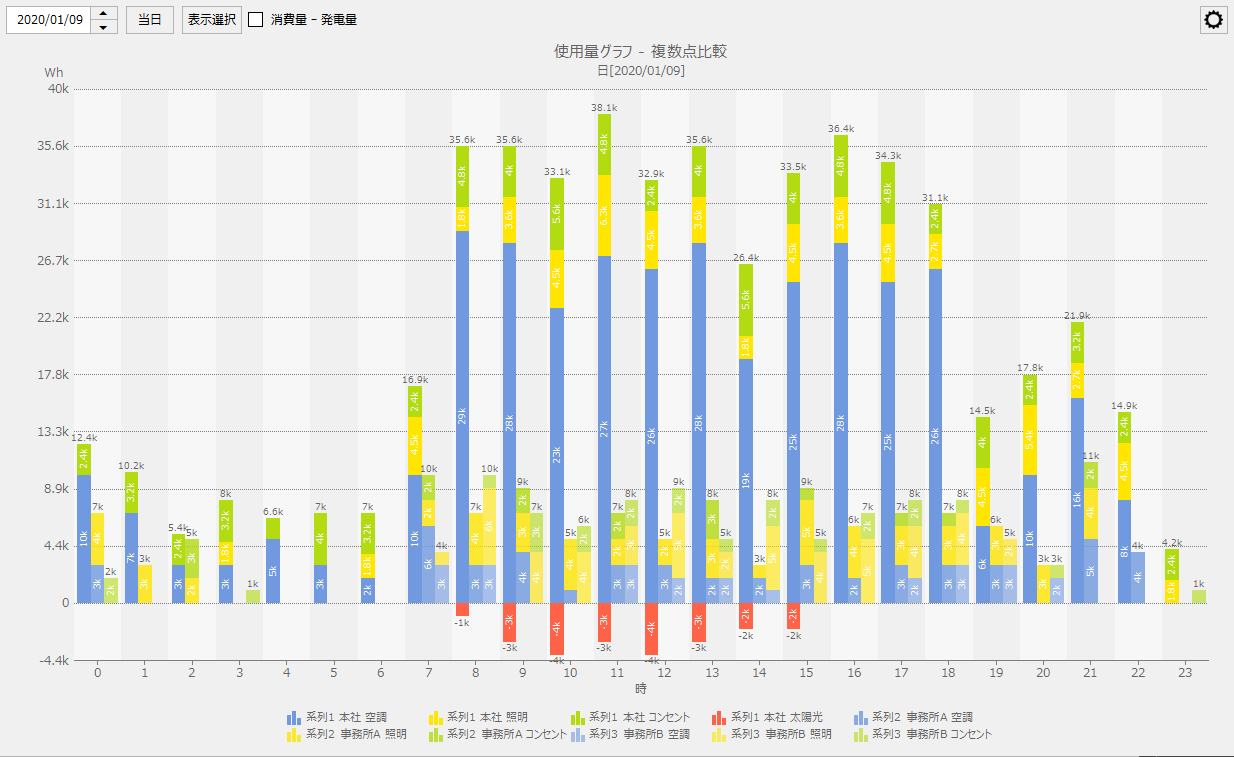
Power generation and consumption
|
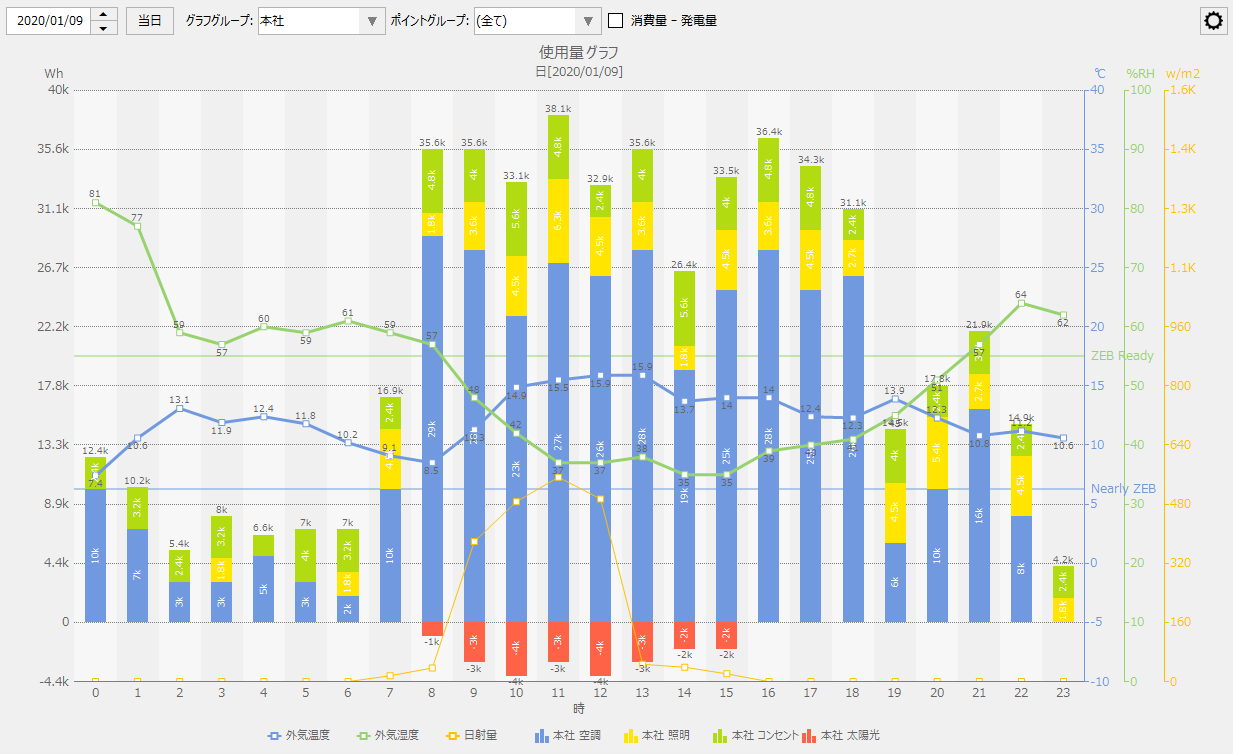
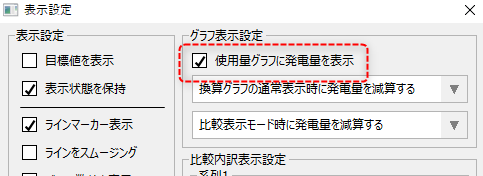
Data that has been registered in advance as the amount of power generation (energy creation) can be displayed as a negative value.
This display method can only be selected when the graph type is a usage graph and the display mode is either the comparison breakdown display mode, the multiple point comparison display mode, or no display mode is specified (normal display).
|
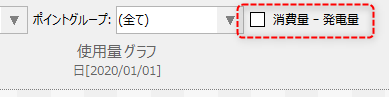
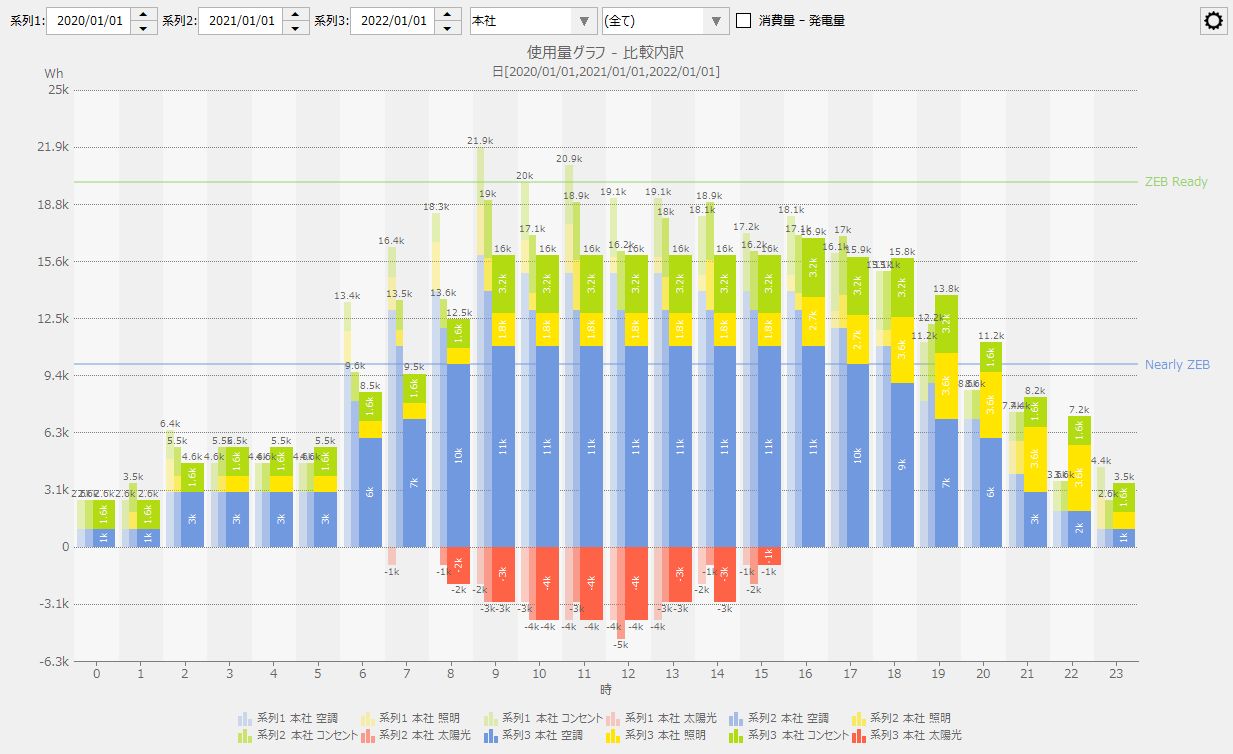
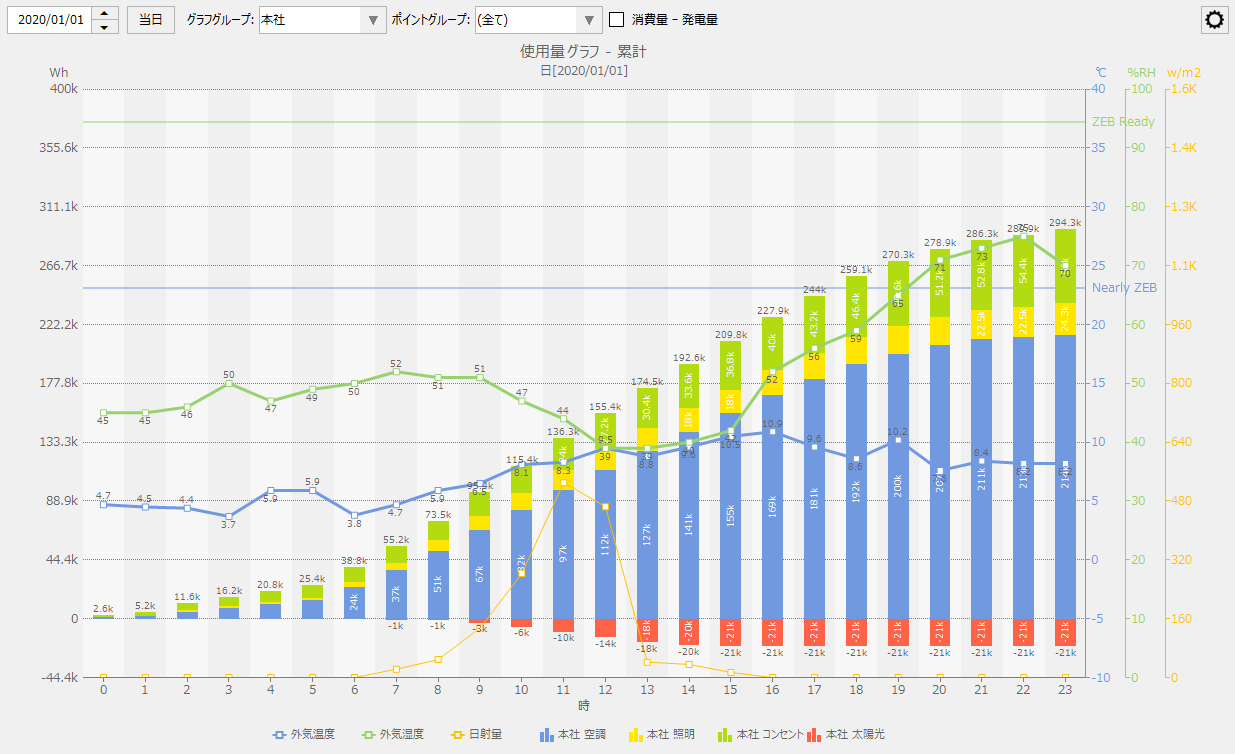
When viewing power generation and consumption, a check box labeled "Consumption - Power Generation" will appear at the top of the screen.
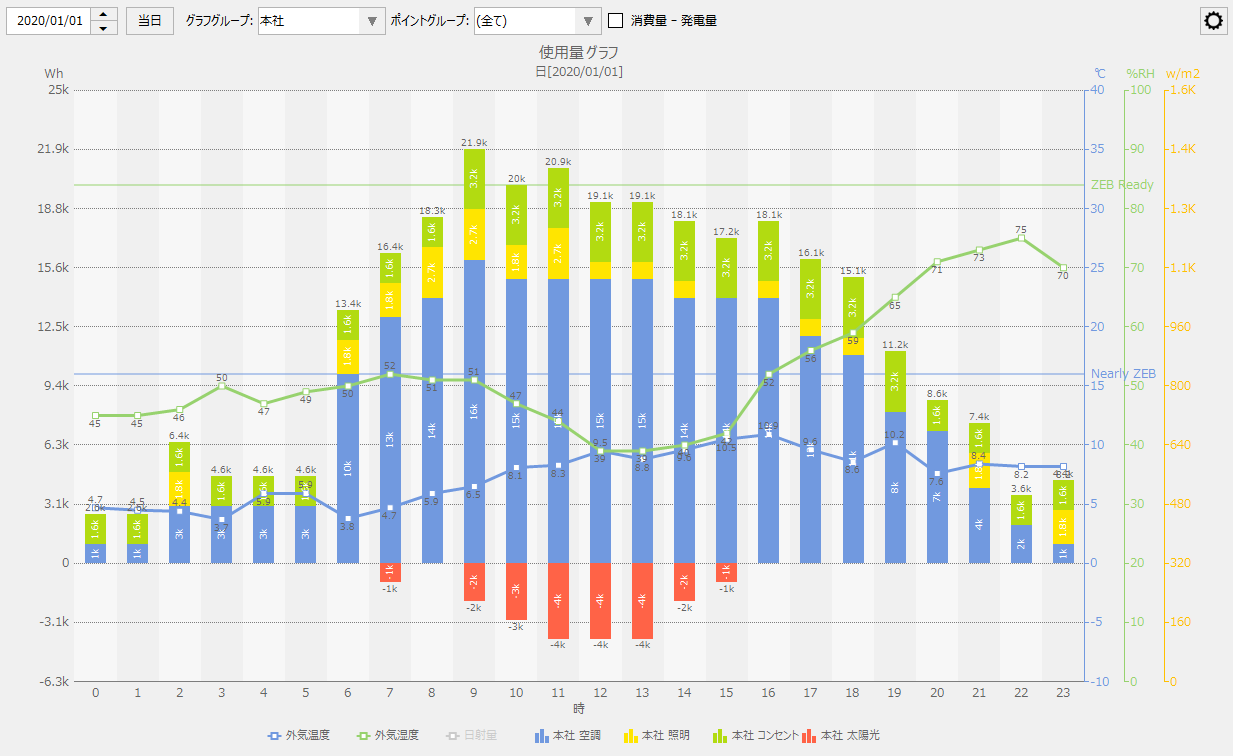
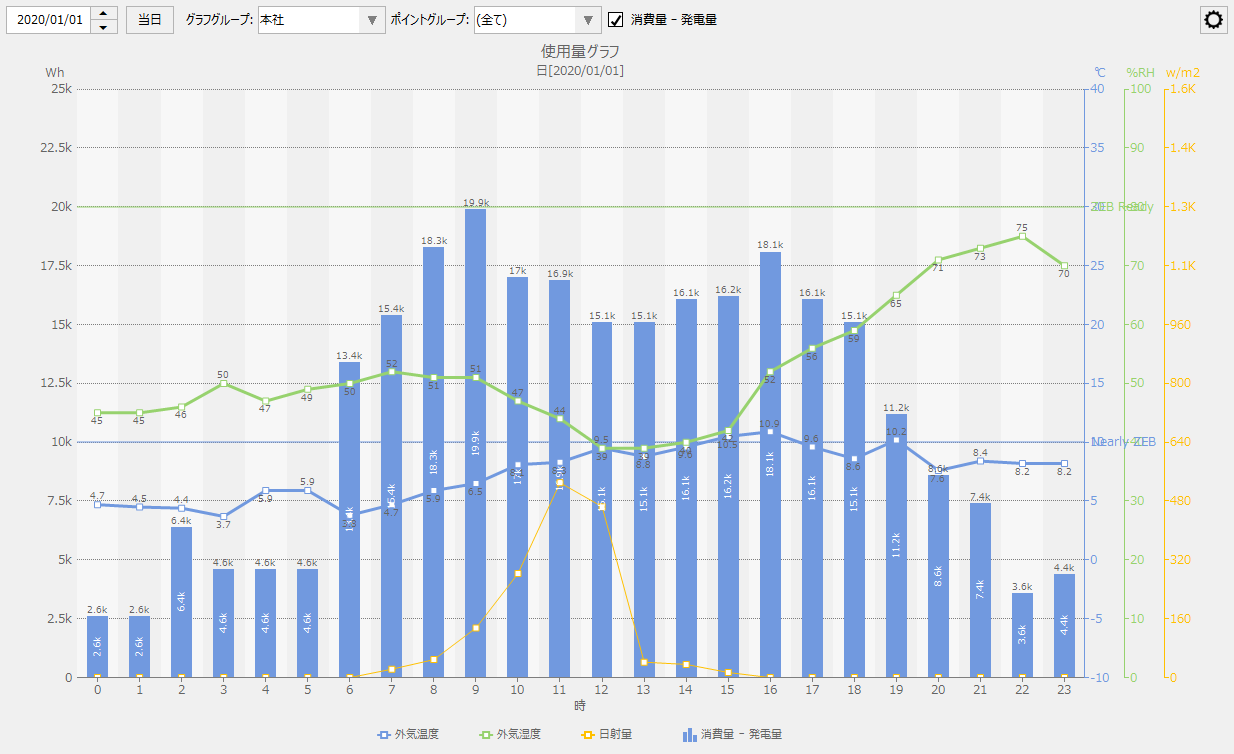
If you check the box above, the graph will show the total amount of electricity generated (created energy) minus the total amount of energy consumed.
(Example when "Consumption - Power Generation" is OFF)
(Example of "Consumption - Power Generation" turned ON)
|

The graph display modes available are "Comparison display", "Comparison breakdown display", "Multiple point comparison display", and "Cumulative display". The cumulative display mode can be specified at the same time as other display modes (Comparison display, Comparison breakdown display, Multi point comparison display).
You can switch the display mode from the settings menu. Below is the state when no display mode is selected (no display mode specified).
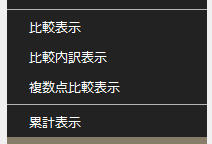
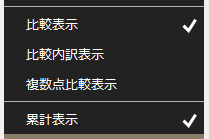
The currently selected display mode is indicated with a check mark as shown below. Each time you click a menu item, the selected or unselected state will be switched.
Display Mode |
explanation |
Screen image |
||
Comparison display |
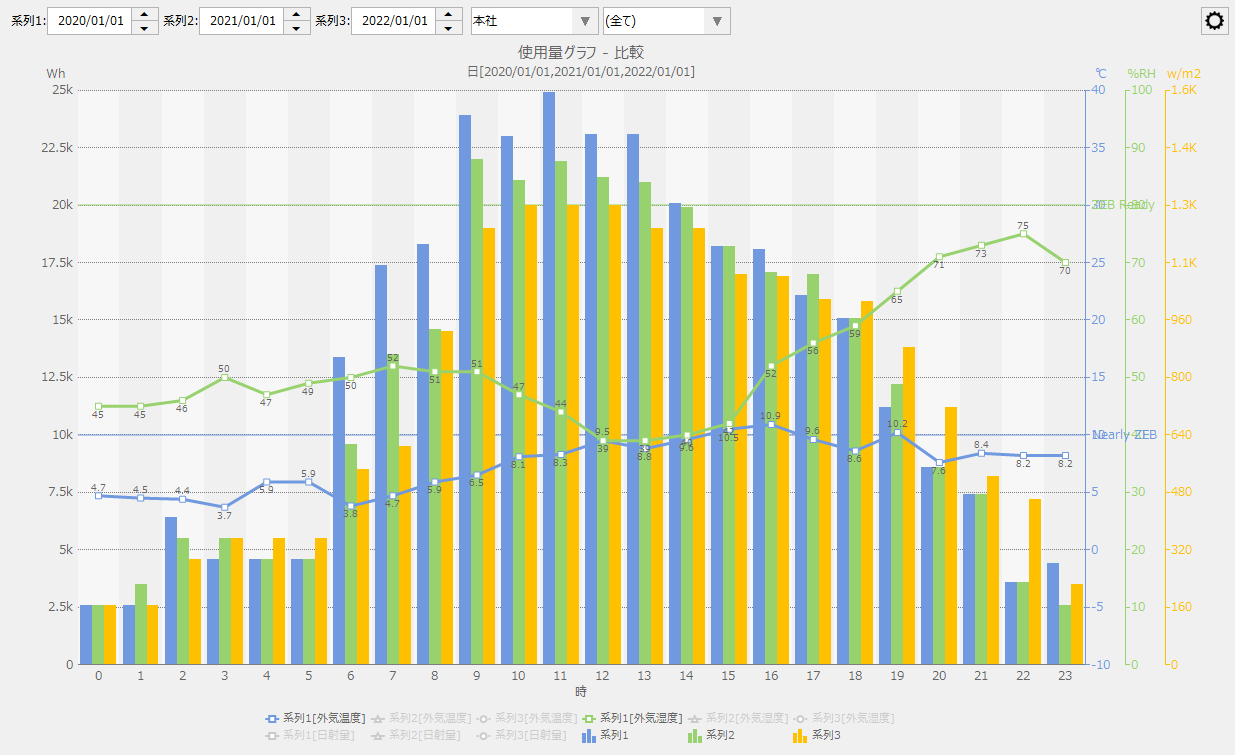
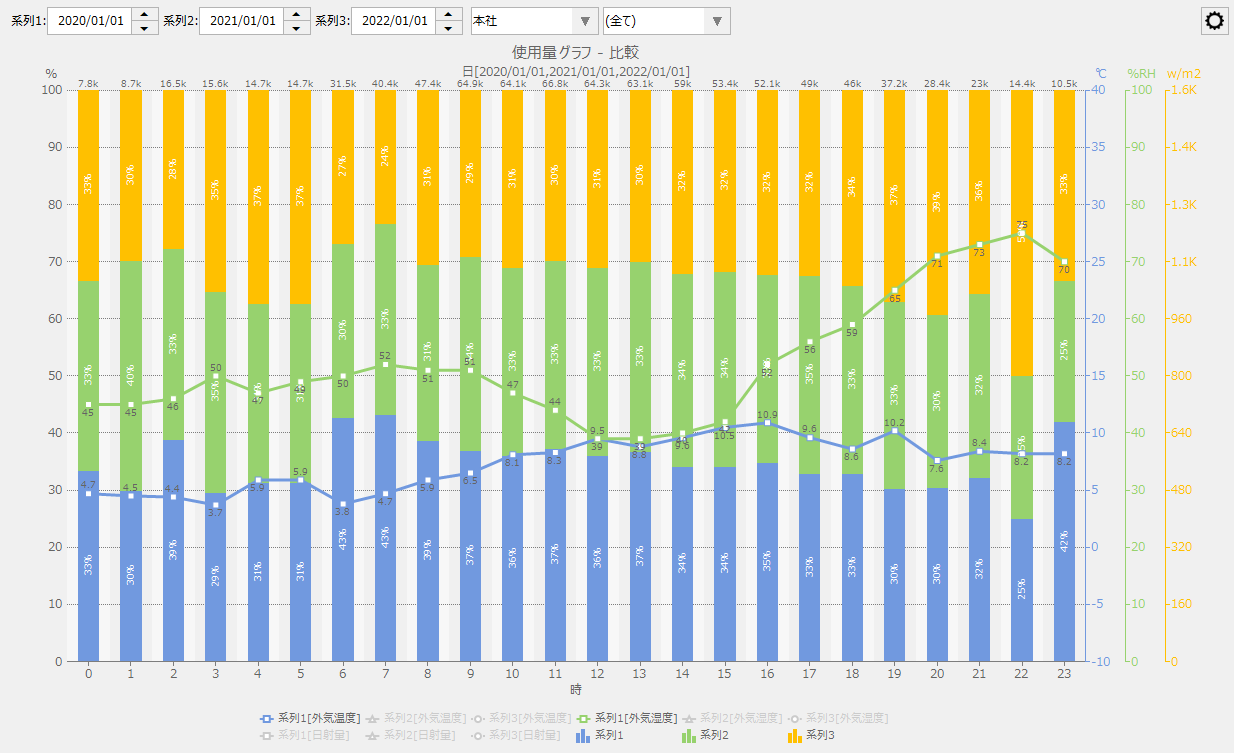
The comparison display mode is a mode in which the total values of each measurement data included in the selected graph group and point group are displayed side by side for comparison based on up to three time series selected from the screen in the usage graph, energy conversion graph, crude oil conversion graph, and CO2 conversion graph.
In the comparison display mode, you can select from the following display methods: "Grouped Bar", "Stacked Bar", "100% Stacked" and "Circle".
|
Below is an example of a usage graph displayed in comparison mode as "grouped bars."
Below is an example of a usage graph displayed in comparison mode as a stacked bar graph. The total value for each time series is displayed as a stacked bar graph.
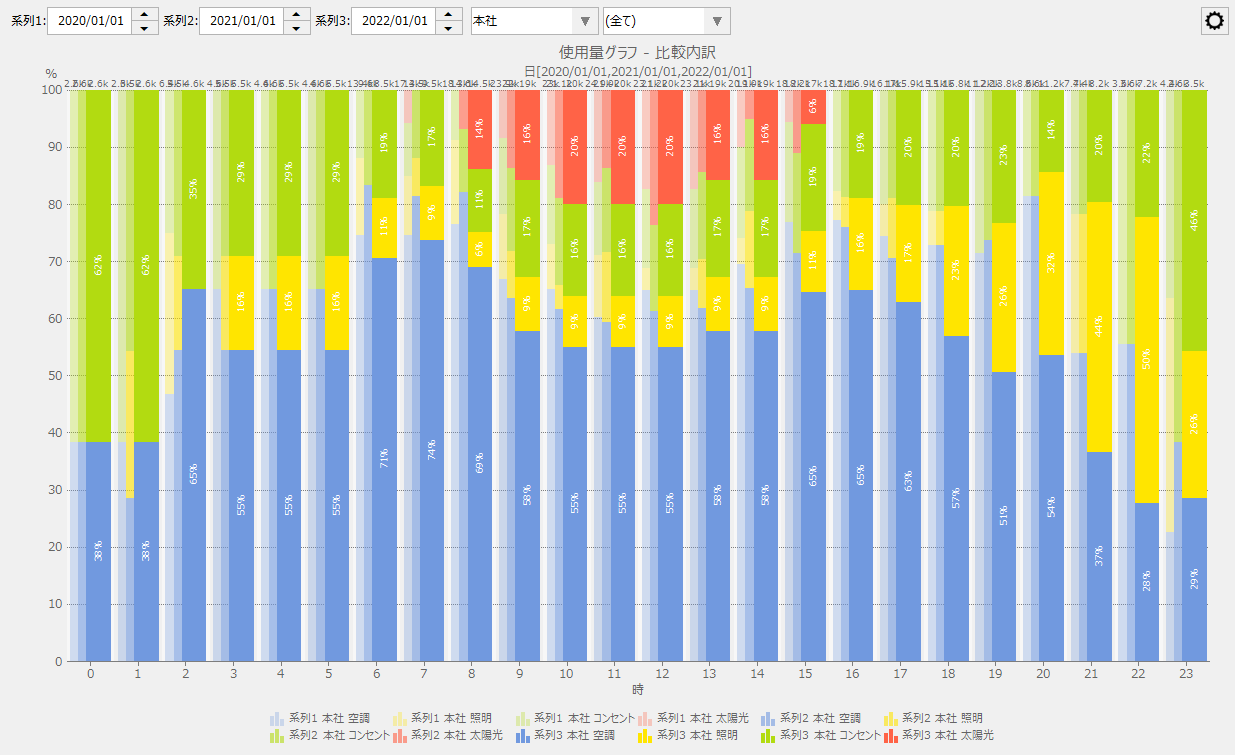
Below is an example of a usage graph displayed in comparison mode with the display method set to "100% stacked." The total value for each time series is displayed as a 100% stacked bar graph.
|
||
Comparison breakdown display |
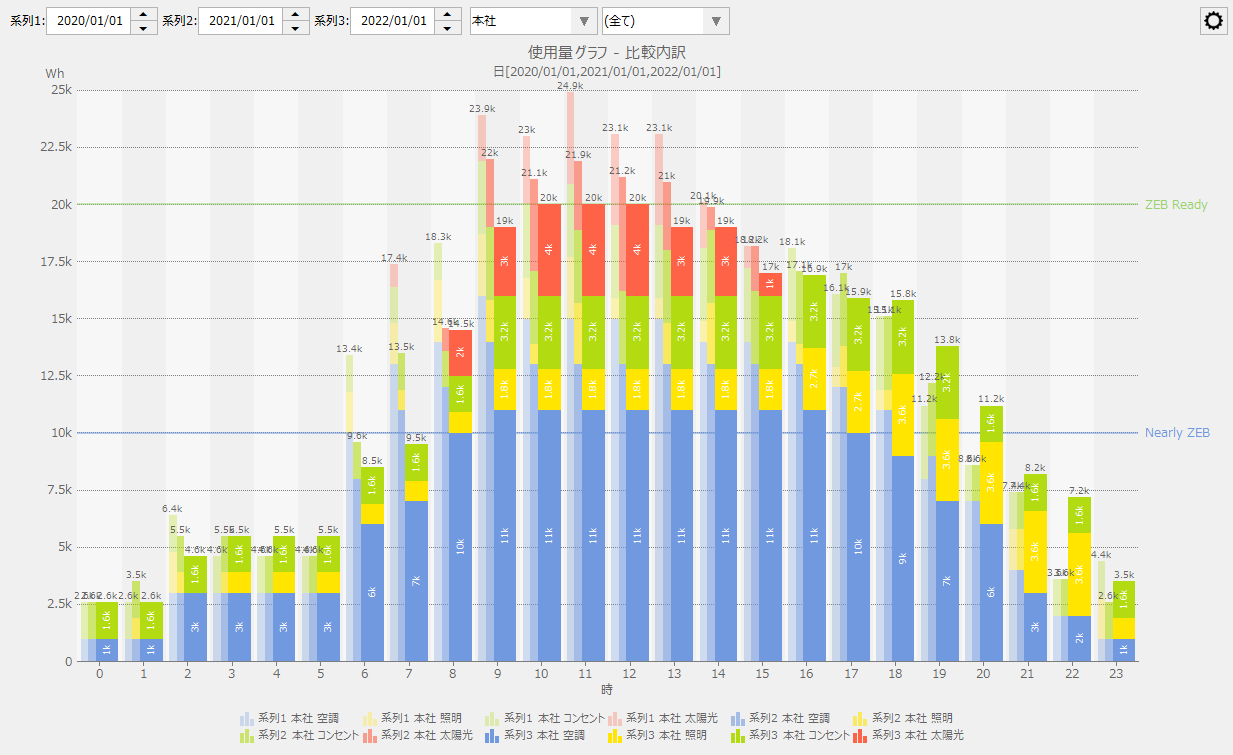
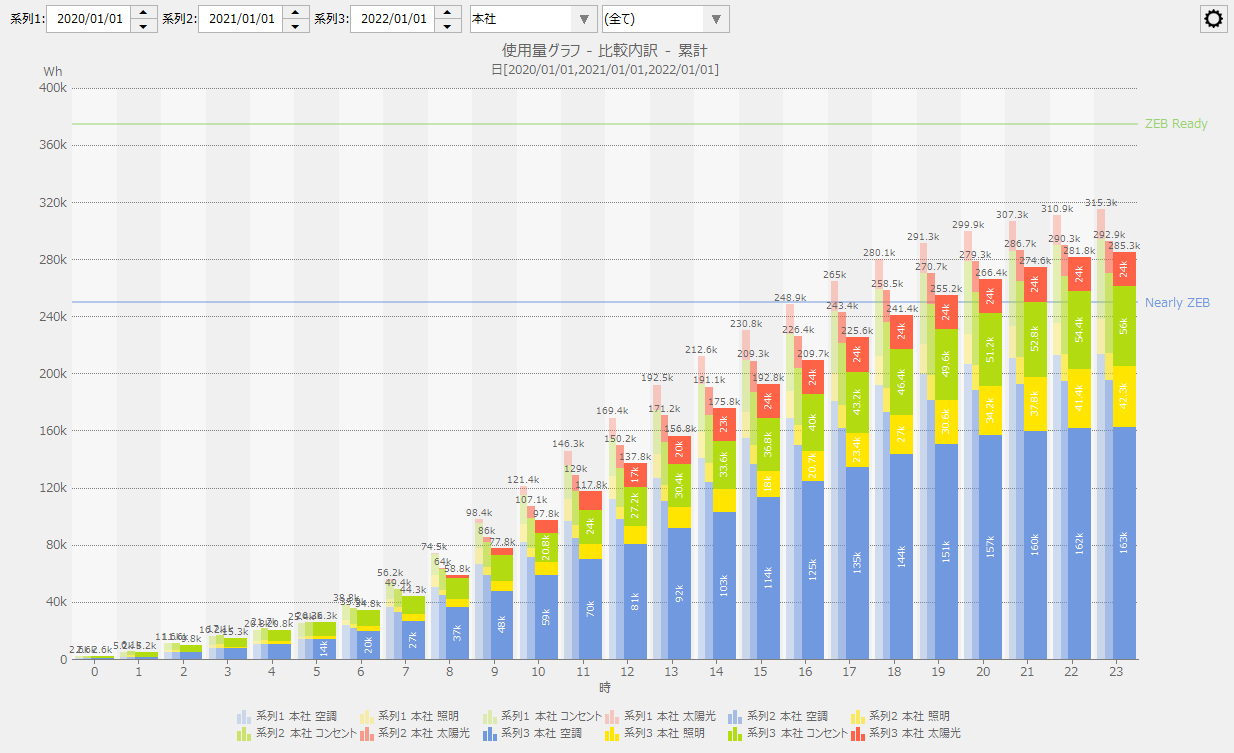
The comparison breakdown display mode displays the breakdown of the aggregated results of the measurement data for each point group included in the selected graph group (or, if a point group is selected, the aggregated results for each individual measurement data included in the selected point group) in a stacked graph based on up to three time series selected from the screen in the usage graph, energy conversion graph, crude oil conversion graph, and CO2 conversion graph.
In the comparison breakdown display mode, you can select the display method as either "Stacked vertical bars", "100% stacked", or "Power generation/consumption" for the usage graph, or either "Stacked vertical bars" or "100% stacked" for the energy conversion graph, crude oil conversion graph, and CO2 conversion graph.
|
The following is an example of the usage graph comparison breakdown display mode with the display method set to "Stacked vertical bars." The breakdown of the selected graph group is displayed in stacked format.
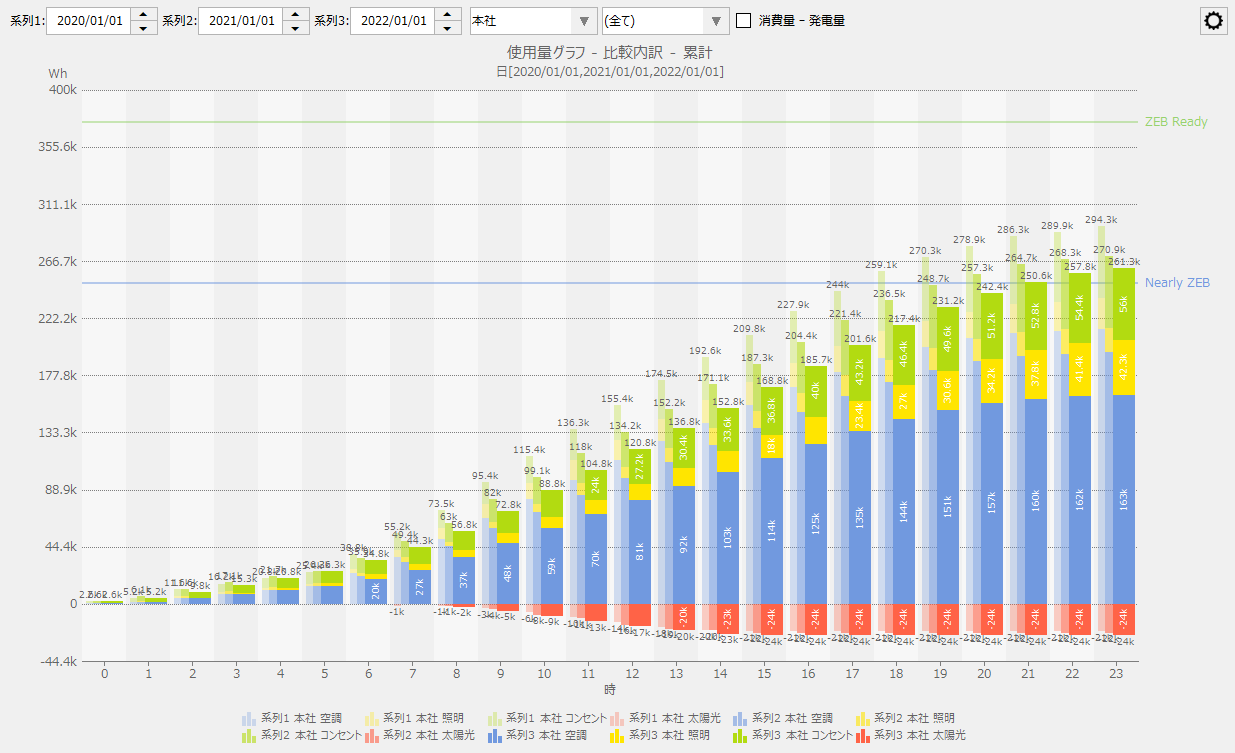
The following is an example of the usage graph with the display method set to "Energy Generation/Consumption" in the comparison breakdown display mode. Among the breakdowns of the selected graph group, the amount of energy generated (energy creation) is displayed in the negative direction.
|
||
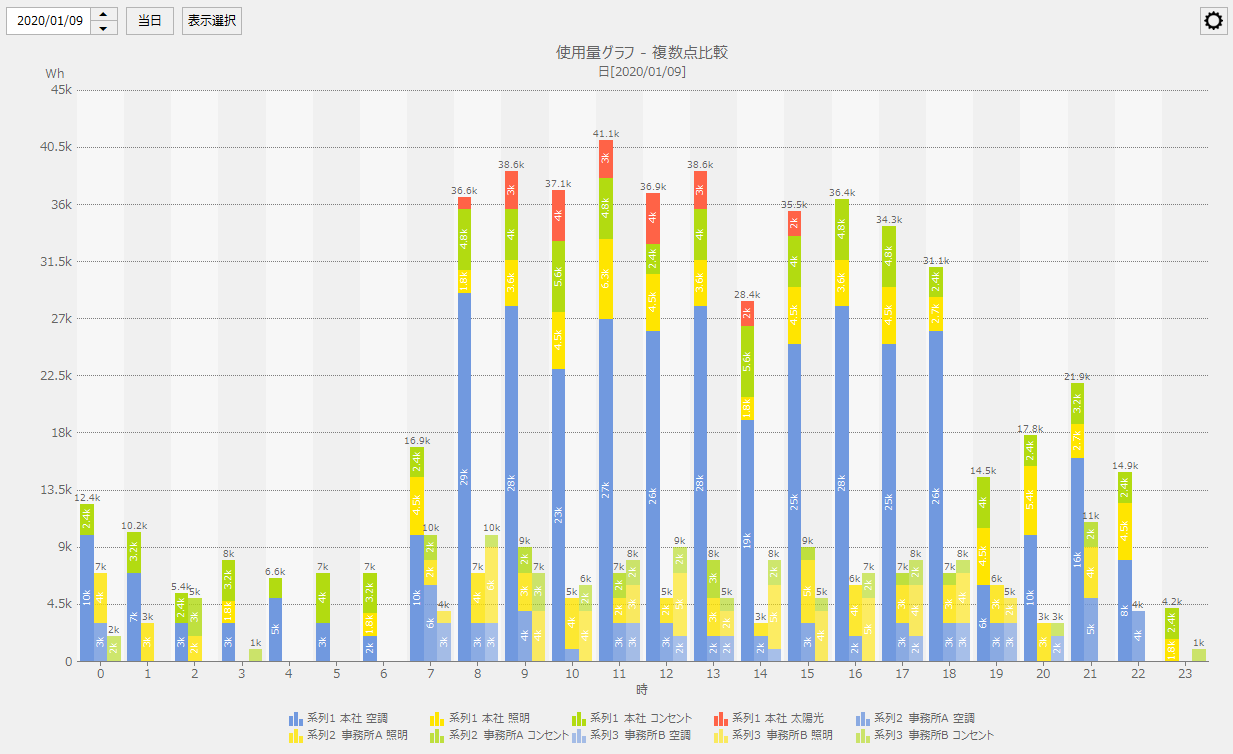
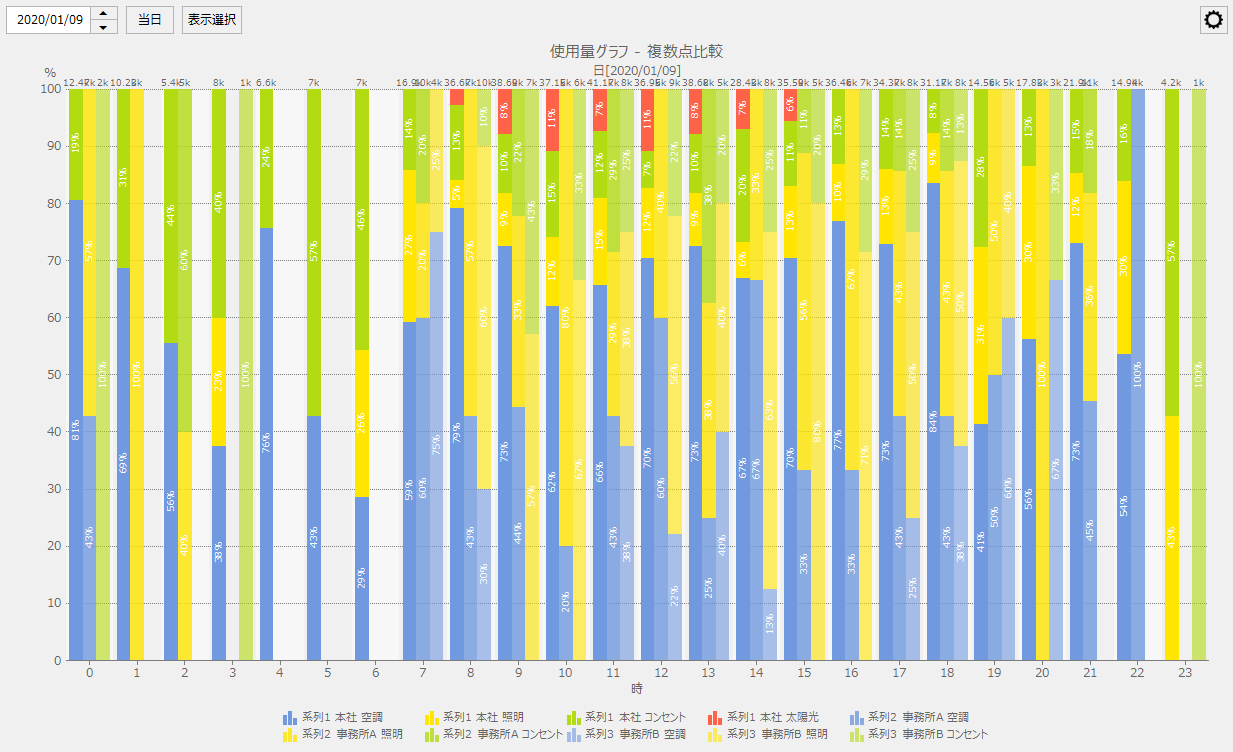
Multiple point comparison display |
The multiple point comparison display mode displays the aggregated results of measurement data for up to three graph groups selected from the screen in the usage graph, energy conversion graph, crude oil conversion graph, and CO2 conversion graph (or, if a point group is selected, the aggregated results for each individual measurement data included in the selected point group) in a stacked graph.
In the multiple point comparison display mode, you can select the display method as either "Stacked vertical bar", "100% stacked", or "Power generation/consumption" for the usage graph, and either "Stacked vertical bar" or "100% stacked" for the energy conversion graph, crude oil conversion graph, and CO2 conversion graph.
|
The following is an example of the usage graph in multi-point comparison display mode with the display method set to "stacked vertical bars."
|
||
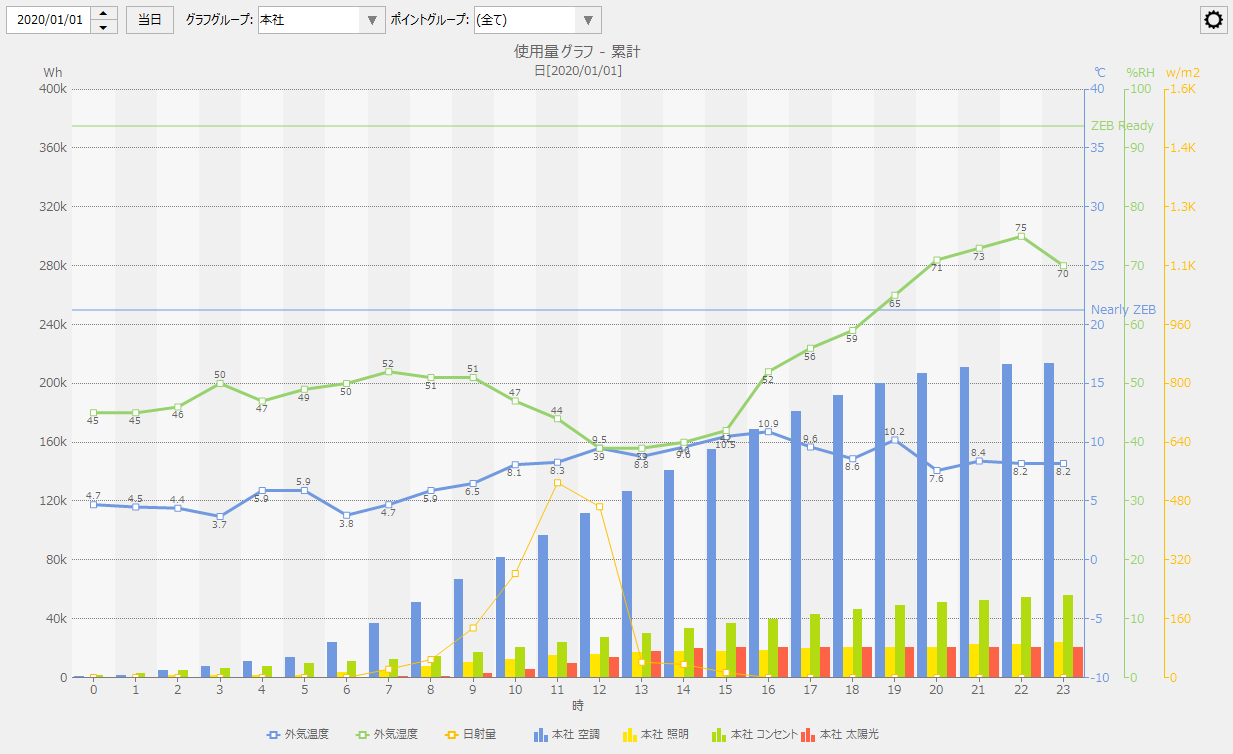
Cumulative display |
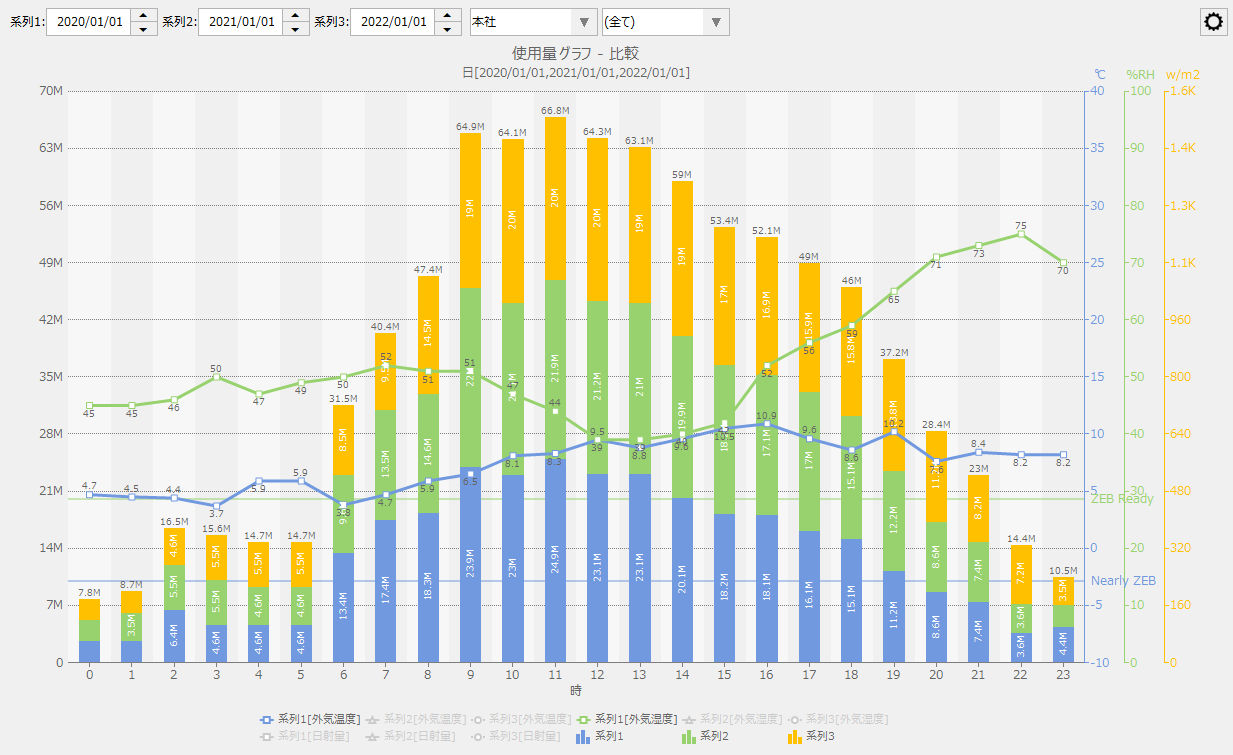
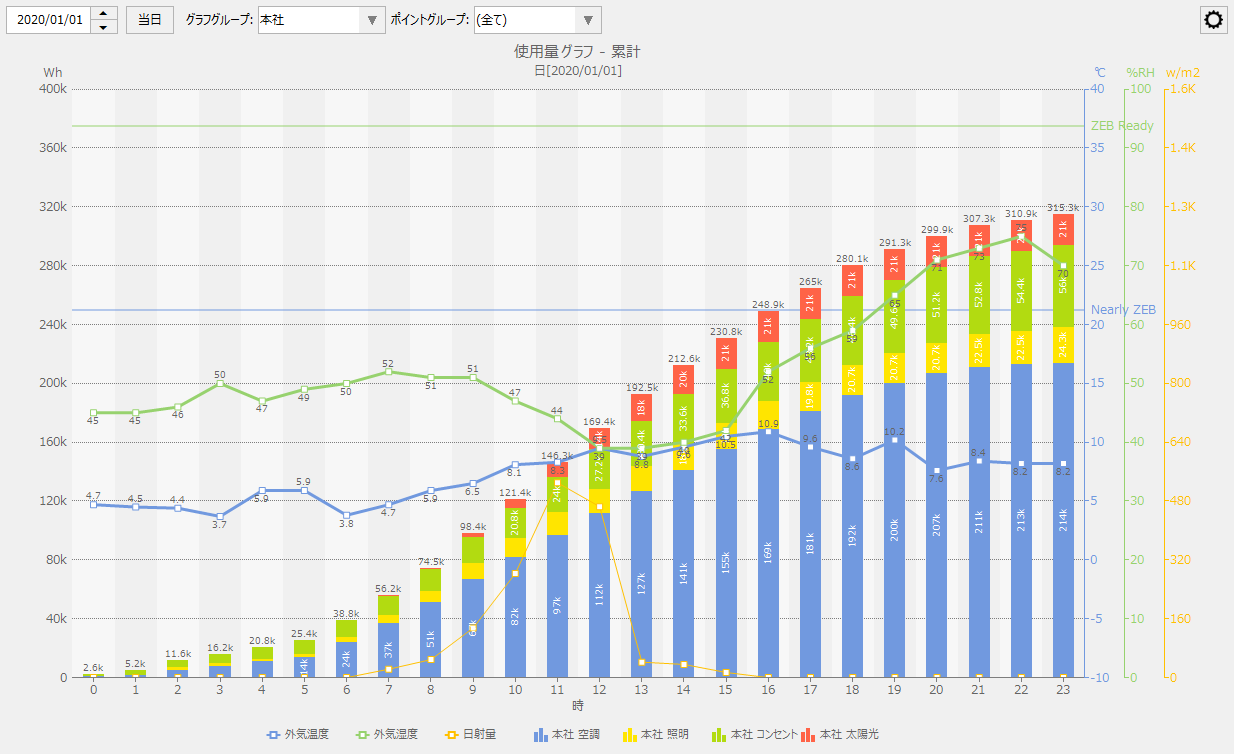
In the cumulative display mode, the usage amount graph, energy conversion graph, crude oil conversion graph, and CO2 conversion graph are displayed as a bar graph, accumulating the usage amount for the display period corresponding to the date specified on the screen.
In the cumulative display mode, you can select from "grouped bar", "stacked bar", or "power generation/consumption" for the usage graph, and "grouped bar" or "stacked bar" for the energy conversion graph, crude oil conversion graph, and CO2 conversion graph.
|
The following is an example of the usage graph in cumulative display mode with the display method set to "grouped bars."
|
|
If the graph type is "ranking graph", none of the display modes can be specified. |
