The relationship between energy management and action
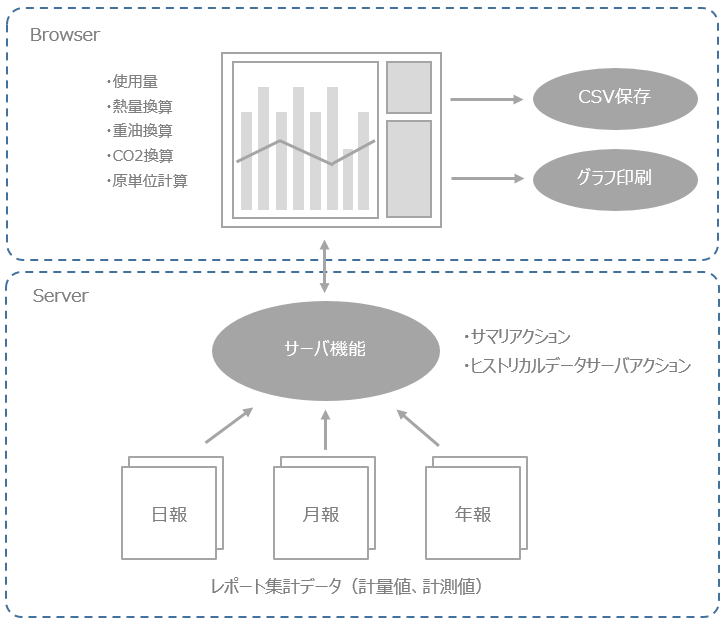
The energy management function consists of server functions (summary actions, Historical data server actions) on the Panel Server side and the energy management screen library on the client side.
The energy management screen connects to the server function defined in Panel Server and retrieves the various aggregated data to be displayed (daily report data, monthly report data, yearly report data) based on the specified date conditions requested by the screen, and displays it as a graph.
Destination Server Actions
The server functions that can be connected from the energy management function are as follows.
kinds |
Commentary |
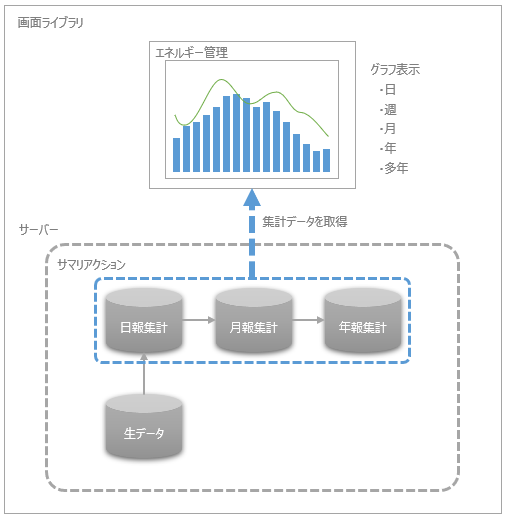
Summary actions are actions for logging and aggregation that integrate logging, aggregation, and report functions. The energy management screen can be connected to a summary action to obtain and display aggregated data in Daily/Monthly/Yearly Report units.
|
|
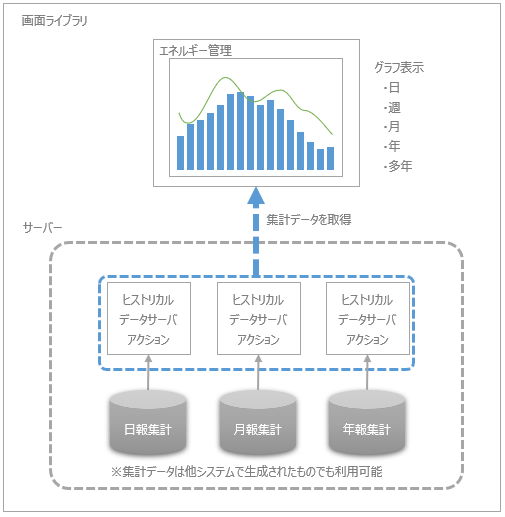
Historical data server is an action for mapping externally created historical data (time series data created with CSV, etc.). The energy management screen can connect to Historical data server to obtain and display each aggregate data of Daily/Monthly/Yearly Report.
This method is intended for use when you want to display graphs of Daily/Monthly/Yearly Report data that has already been aggregated by another system.
|
Each of the above actions is available in two types: CSV and ODBC, and you can connect to either type.
For information on the types of DBMS that can be connected, please refer to "About supported databases".
|
If you want to generate aggregated data using only the mechanisms provided by FA-Panel, use summary actions. On the other hand, if you want to import aggregated data generated by another system and perform energy management, use Historical data server actions. Summary actions and Historical data server actions can also be run simultaneously in parallel. For example, you can aggregate Daily/Monthly/Yearly Report using a summary action in your own system, while importing aggregated data collected by an external system, and display both side by side on the same energy management graph. |

■ Via summary action
When using summary actions to aggregate data, the summary action must be configured to aggregate data using Daily/Monthly/Yearly Report. Usually, only one summary action needs to be registered on the server side, and Daily/Monthly/Yearly Report is registered in the summary unit settings.
|
When using a summary action, set the summary name of the daily report summary, monthly report summary, and yearly report summary in the "_SummaryLogType" custom property on the energy management screen, separating them with a semicolon (;). |
|
In the weekly graph display for energy management, one week's worth of daily report aggregate data is obtained and displayed. There is no need to prepare weekly aggregate data. |
■If via Historical data server
You can import data collected by other systems via an action. In this case, you need to register separate actions to connect to daily, monthly, and annual data.
|
When using the Historical data server action, set the field name of the daily report summary, the field name of the monthly report summary, and the field name of the yearly report summary in the "_HistoricalLogType" custom property on the Energy Management screen, separating them with a semicolon (;). |