Relationship between grouping and graph display
This section explains the relationship between the actual graph display operations and group settings, based on the specific example of grouping introduced in "Example of group settings for energy management".
•Displaying usage graphs (graph groups/point groups)
•Power generation and consumption display in usage graph
•Displaying conversion graphs (graph group)
•Displaying ranking graphs (graph group)
Displaying the usage graph (graph group/point group)
When you select "Usage graph" from the graph type, the usage graph will be displayed.
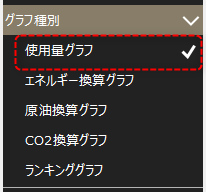
For usage graphs, you can select the graph group and point group from the combo boxes.
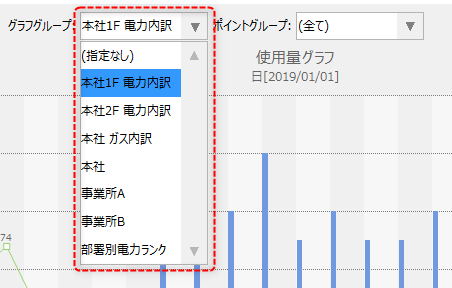
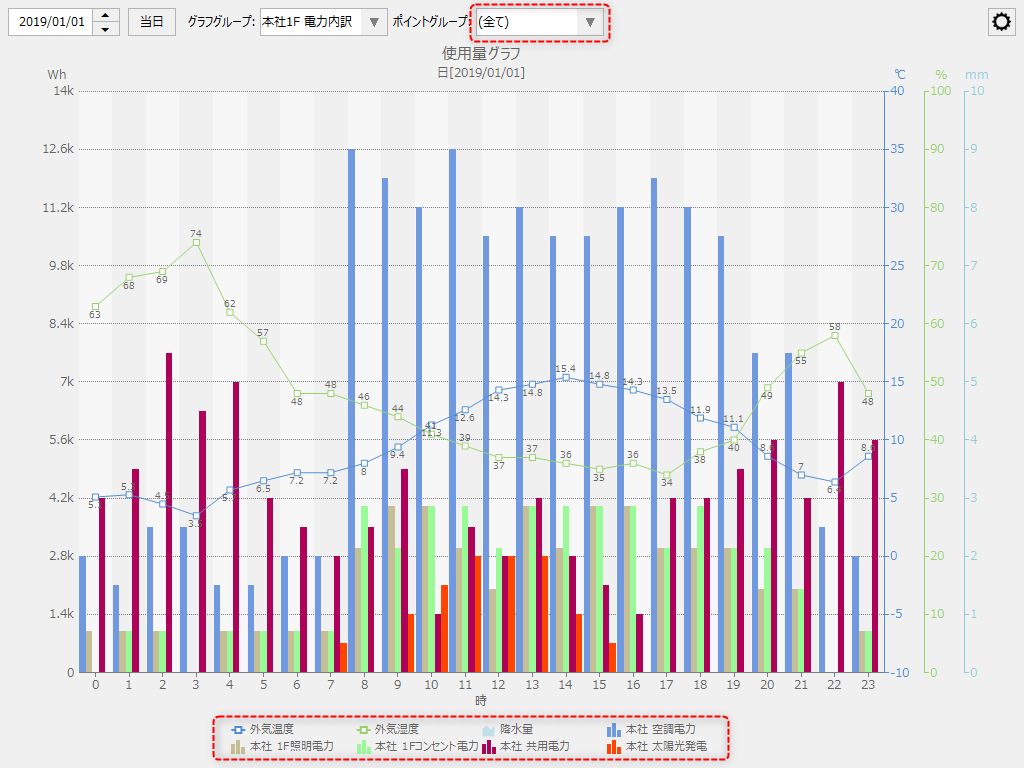
When you select "Head Office 1F Power Breakdown" from the graph group combo box, the point group combo box will display "(All)" and a usage graph will be displayed for each graph group.
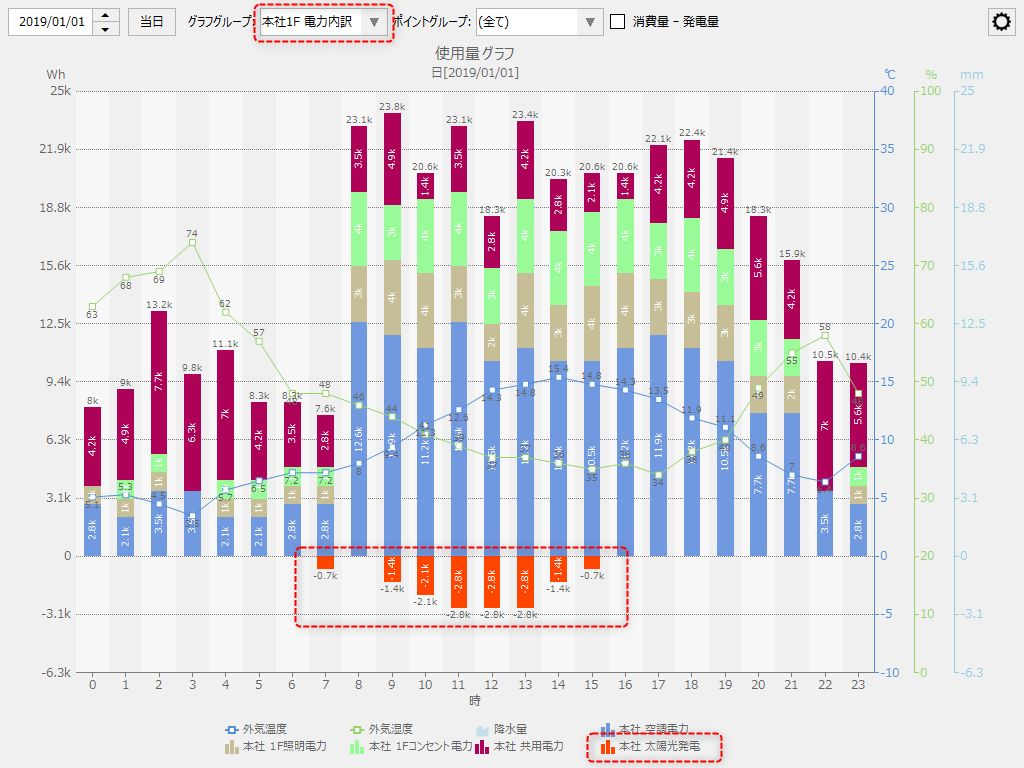
The legend displayed at the bottom of the graph shows all point groups registered in the current graph group (in this case, "Head office air conditioning power", "Head office shared power", "Head office 1st floor lighting power", "Head office 1st floor outlet power", and "Head office solar power generation"). The graph legend is displayed by point group, and the data displayed on each bar of the graph is the total value of the point group.
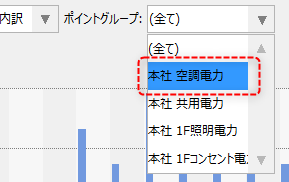
When you open the point group combo box, all point groups contained in that graph group are listed.
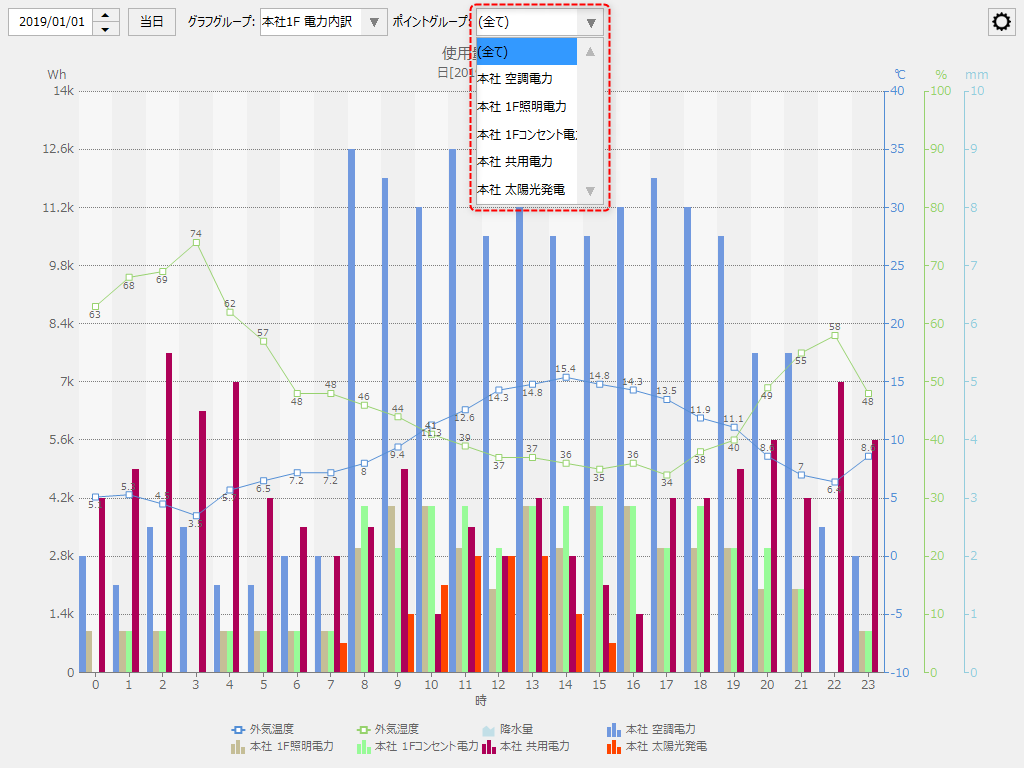
Here, select "Head Office Air Conditioning" from the point group combo box.
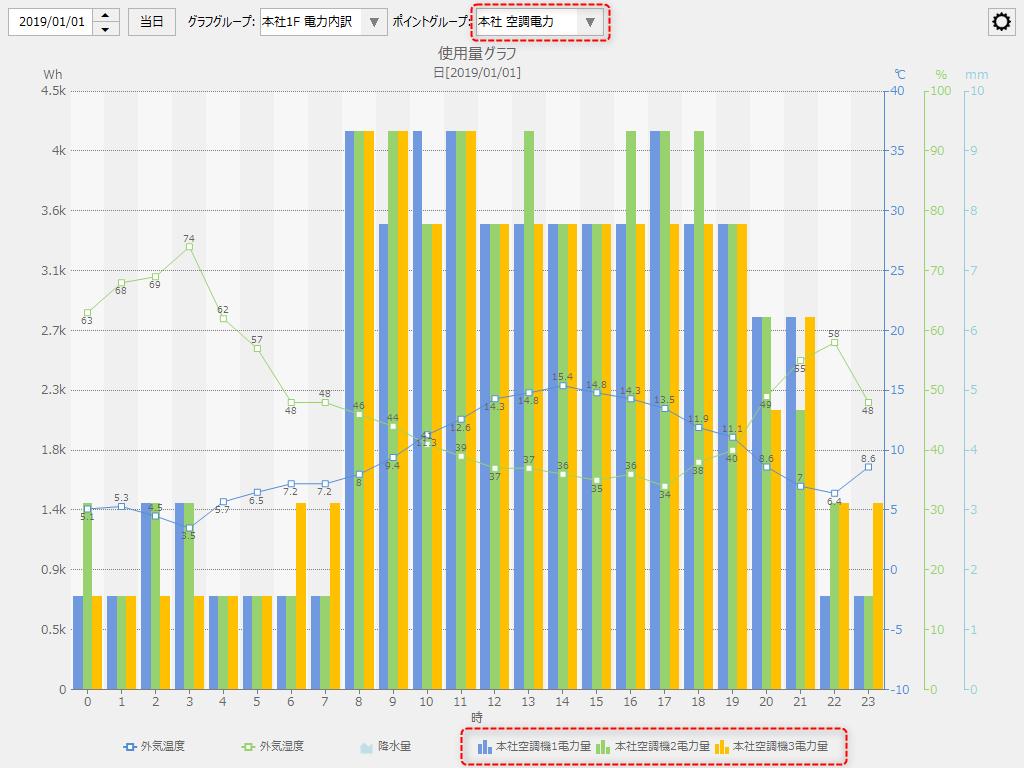
The usage graph will then switch to a point group display, and only the usage included in the selected point group "Head office air conditioning power" will be displayed.
The legend displayed at the bottom of the graph shows the breakdown of the metering points registered in the current point group (in this case, "Head office air conditioner 1 power amount," "Head office air conditioner 2 power amount," and "Head office air conditioner 3 power amount"). The graph legend is displayed in points, and the data displayed on each bar of the bar graph is the usage amount per metering point.
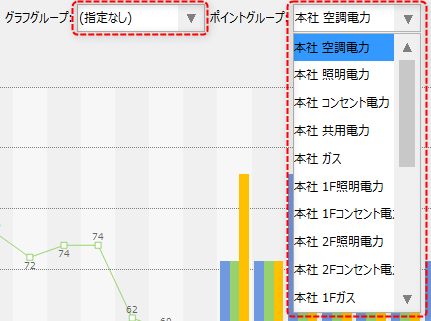
Furthermore, if you select "(None)" in the Graph Group combo box, all registered point groups will be listed in the Point Group combo box. If you want to check the details by point group, you can easily find the desired point group using this method.
In this way, by selecting a graph group and point group on the usage graph, you can display the breakdown of usage by graph group and point group.
|
The graph unit used is set to display only one type.
Since a point group is made up of only metering points of the same type, there is no need to pay special attention to this when displaying usage graphs on a point group basis, but care must be taken when displaying usage on a graph group basis.
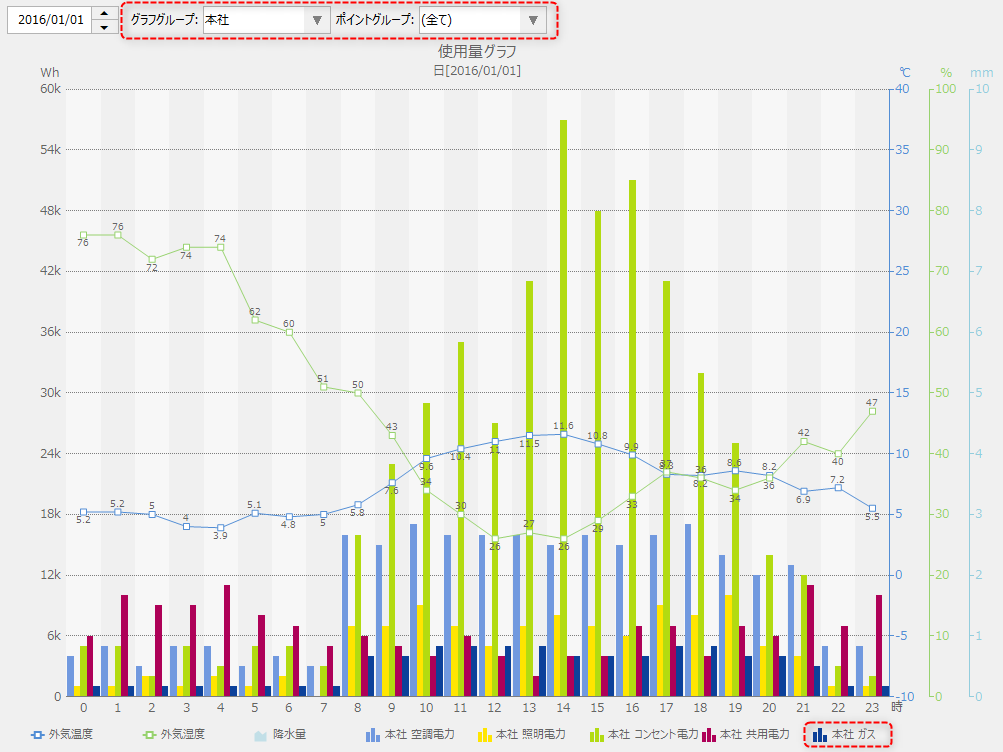
A graph group can have point groups of various types of usage registered. This is because, in an environment where multiple types of energy (such as electricity and gas) are used across the entire facility, it is necessary to mix point groups of different energy types when, for example, you want to display the total energy amount of the graph group on a conversion graph. In this sample example, the graph group "Head Office" contains a mixture of electricity and gas usage. If you display the graph group "Head Office" in a usage graph and set the point group to "(All)", a usage graph that contains a mixture of electricity and gas usage will be displayed as shown below. This will result in a contradictory display in which a bar graph of gas usage is displayed within electricity usage, but this behavior is within the specifications. Therefore, when setting up a graph group, be sure to register it while keeping in mind what graph the graph group will be used to display, and select the appropriate group to display the graph.
(An example of a usage graph showing different types of energy mixed together)
|


Usage graph showing power generation and consumption
When you select "Usage graph" as the graph type and "Power generation/consumption" as the display method, the power generation/consumption will be displayed on the usage graph.
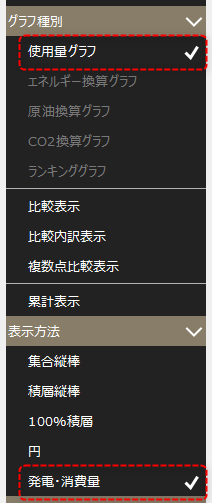
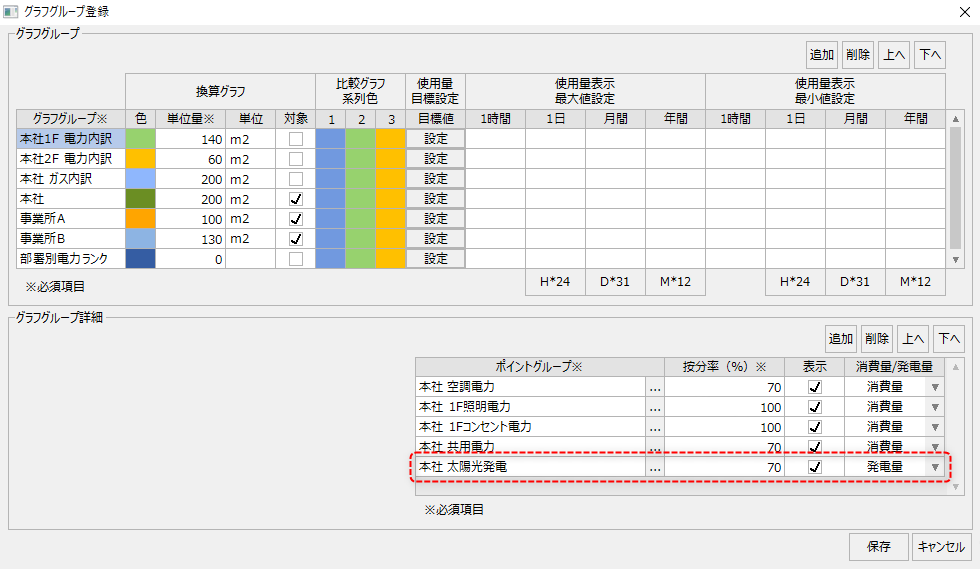
If the display method is set to "Power generation/consumption", and the point group registered in the currently selected graph group contains power generation, it will be displayed in the negative direction as shown below.
In addition, when using a display method other than "power generation/consumption," the amount of power generation is treated the same as normal usage. Below is an example of a usage graph displayed as stacked vertical bars.
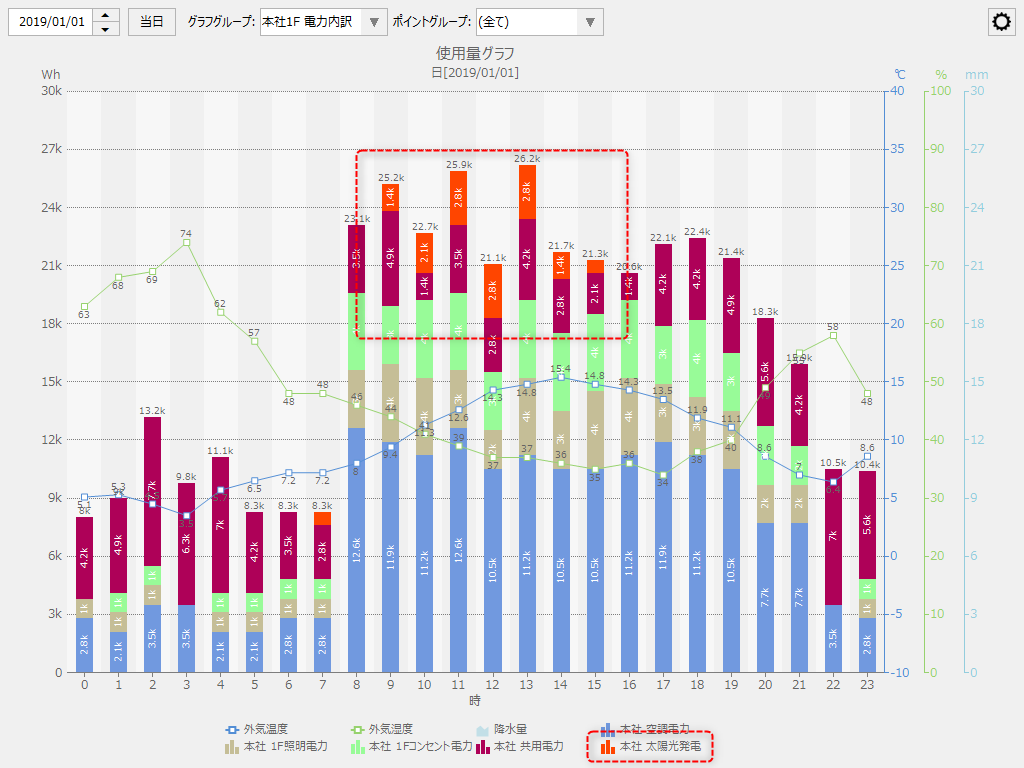
If you want to temporarily hide the amount of power generation from the usage graph, you can toggle the display on and off by clicking on the legend.
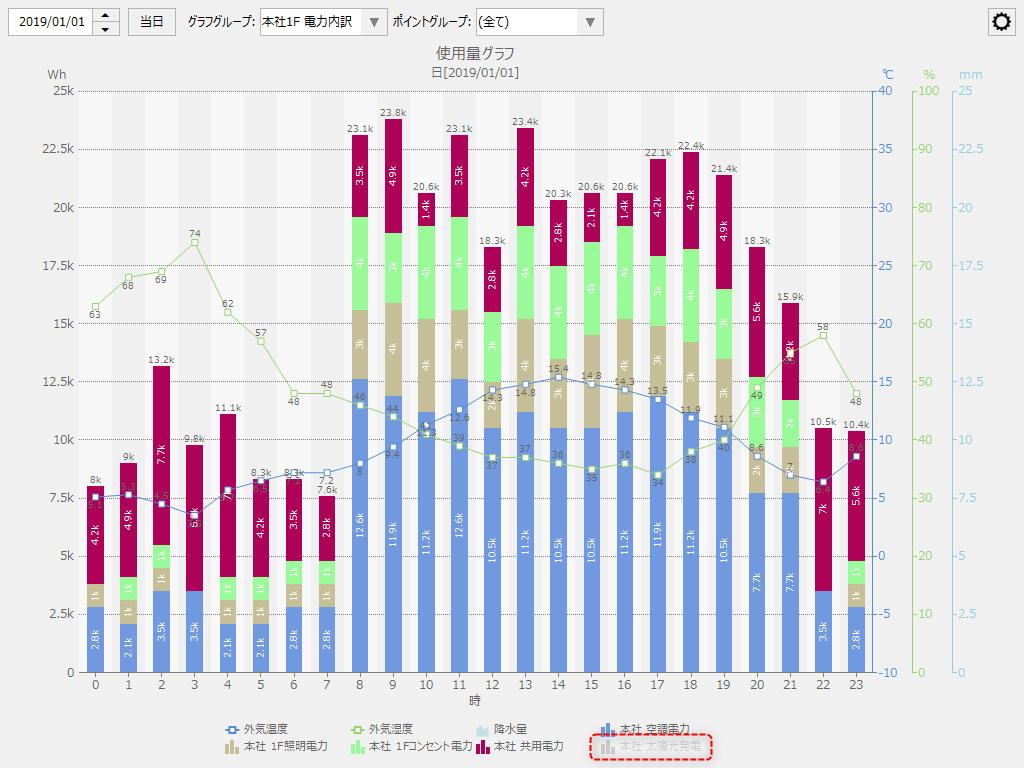
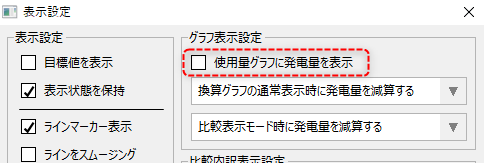
Alternatively, you can hide the amount of electricity generated from the usage graph by unchecking "Show electricity generated in usage graph" in the display settings (note that even if you uncheck this box, the amount of electricity generated will still be displayed on the graph when "Energy Generation/Consumption" is displayed).
Displaying conversion graphs (Graph group)
Select "Energy conversion graph," "Crude oil conversion graph," or "CO2 conversion graph" from the graph type to display the conversion graph.
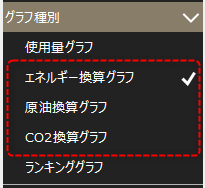
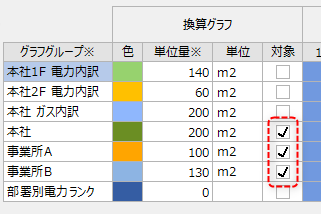
The graph group and point group selection combo boxes are not displayed on the conversion graph. On the graph group setting screen, graph groups that have a check in the "Target" column for the conversion graph are displayed on the conversion graph.
In the graph group settings for this sample, the conversion graph display is checked for "Head Office," "Office A," and "Office B."
Below is an example of an energy conversion graph.
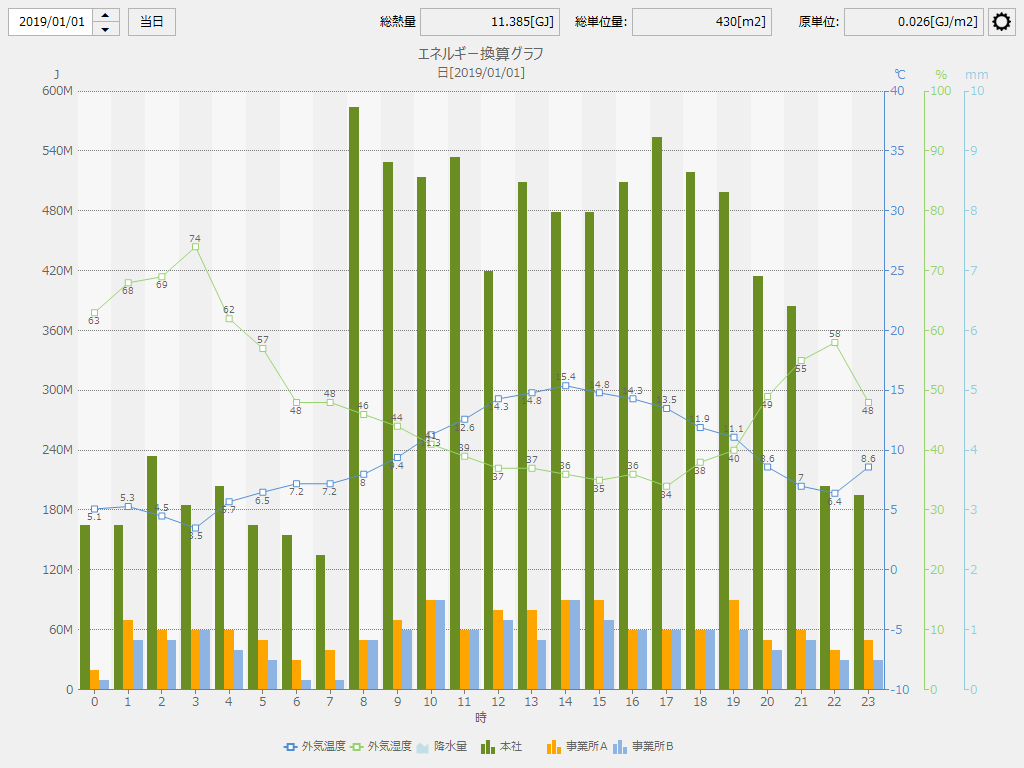
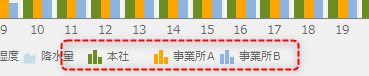
If you look at the legend at the bottom of the graph, you can see that only graph groups that have "Target" checked on the graph group settings screen are included (in this example, only "Head Office," "Office A," and "Office B").
Each bar in the conversion graph displays the total converted value for each graph group. In the normal display of the conversion graph (when no display mode is selected), if the point group registered in the graph group to be displayed in the conversion graph contains power generation, the way it is handled is according to the following display settings.
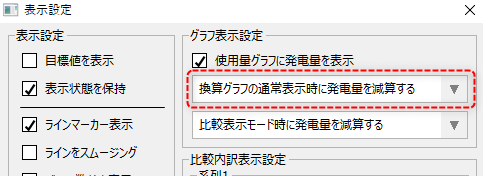
From the above, you can select whether to convert and display the amount of electricity generated minus the amount of electricity consumed (default setting), to exclude the amount of electricity generated from the conversion, or to include the amounts of electricity consumed and generated in the total amount without distinguishing between them.
Displaying ranking graphs (graph group)
Select "Ranking graph" from the graph type to display the ranking graph.
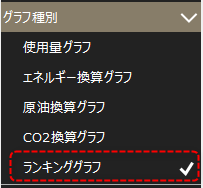
For ranking graphs, you can select a graph group from the combo box.
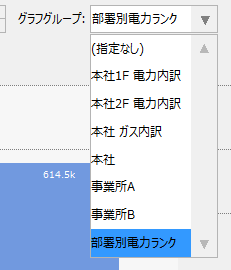
By registering the point groups you want to display as rankings within a graph group, the rankings for each point group will be displayed in descending order on a graph.
The following is an example when "Power Rank by Department" is selected.
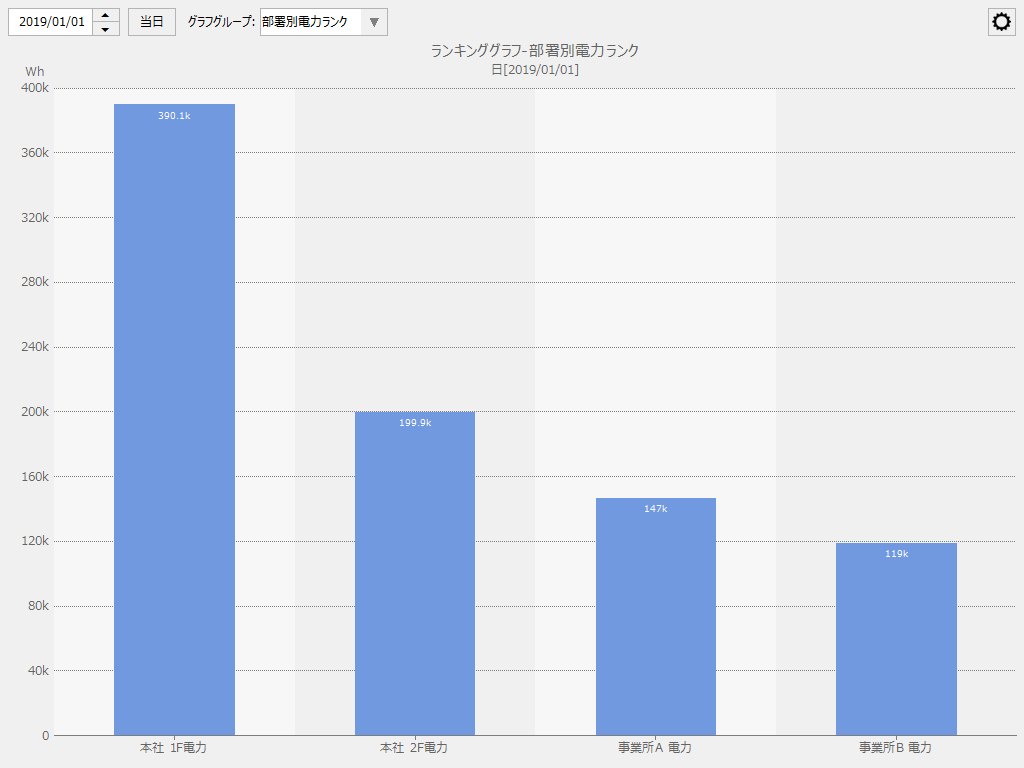
The name displayed at the bottom of the graph is the group name of the point group contained in the currently selected graph group (in this case, "Head Office 1F Power," "Head Office 2F Power," "Office A Power," and "Office B Power").
|
To display a ranking graph, register point groups for the units for which you want to display the rankings (for example, departments, offices, or sections), and then register them in a graph group. |