overview
This is an example of creating a simple signal list using Grid control.
This section explains how to create an analog list screen that displays tag names, meter displays, measurement values, and comments in a list format.
|
For more information about Grid control, please see "Grid control". |

|
In the example shown here, we will use a script to describe the process. For more information on scripts, please refer to "Scripts" in the Screen Creation Guide. |
How to create an analog list screen
1.Prerequisites
In this example, it is assumed that the following tags are registered on the Panel Server side.
- Tag name: 15 consecutive tags, from U01.F01.T01 to U01.F01.T15
- Each numeric tag
2.Preparing the form for analog listing
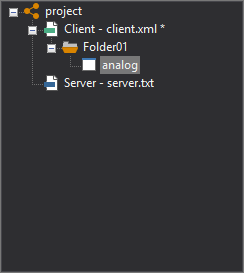
Add one form and change the form name to "analog".
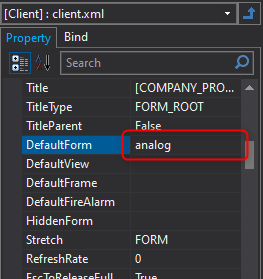
After changing the name of the form, change the DefaultForm root property in the root properties to "analog". Note that if you are in an environment with multiple forms and want to set a different form as the startup form, the above setting is not necessary.
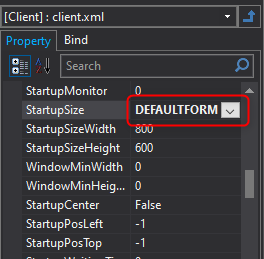
Next, for example, change the StartupSize root property to "DEFAULTFORM". Please feel free to set this according to the screen size you are using.
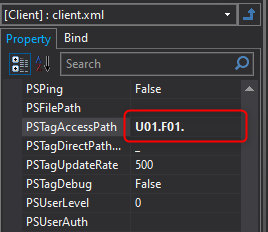
Next, we will use the access path as an example this time. Set the root PSTagAccessPath property to "U01.F01.".
|
The root PSTagAccessPath property can be used to set a tag path prefix. This prefix is called "Access Path". In the above example, "U01.F01." is set, and by doing this, tag names such as "T01" can be specified when binding or specifying tag names from scripts. However, a limitation of this function is that it is not possible to connect to tags other than those under "U01.F01.". When connecting to multiple PLCs or registering tags in separate folders, do not use the PSTagAccessPath root property. |
3.Creating a screen layout
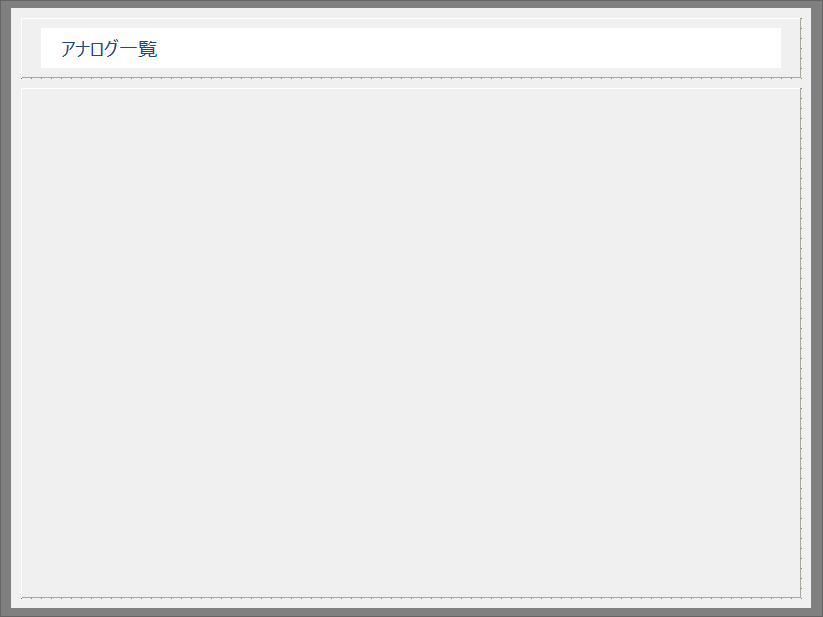
Use 3D frame control and Label control to create your own screen layout.
The following is an example.
4.Paste Grid control
Place Grid control near the center of the screen above.
From the control view, select Grid control and paste it into the form.
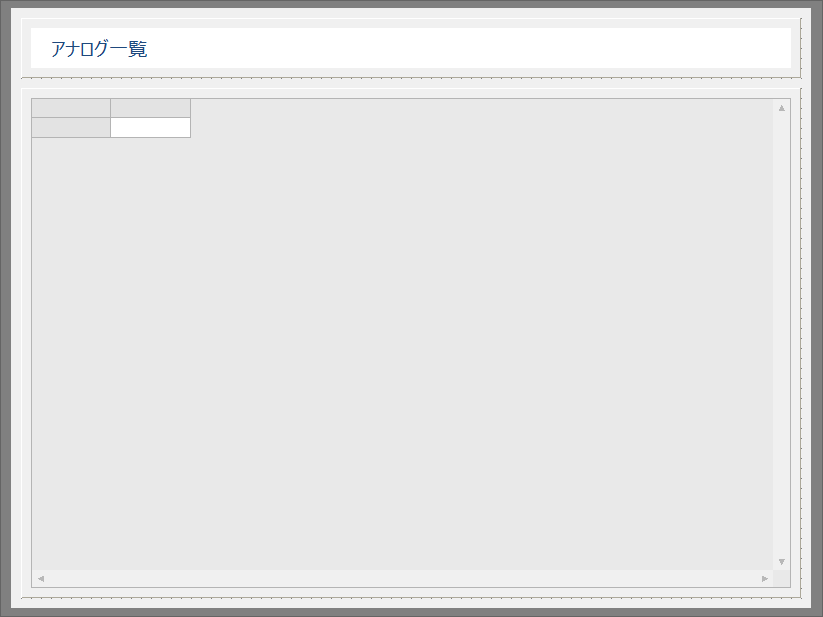
The above is the state immediately after pasting the grid.
Change the grid properties below.
・Set DefaultHeight to 30
・Set HeaderCols to 0
・Set HorizontalScroll to False
*Properties other than those mentioned above can be changed using scripts.
5.Grid initialization script
To use a grid, you must initialize the object from a script. Write the initialization script in the grid's OnInitialize event.
Please write the script in the OnInitialize event by referring to the following.
event OnInitialize() |
(Explanation)
"this" such as
this.Cols refers to the object itself. You can access the properties and methods of the object itself from a script using the format this.xxx.
To recognize a tag from an object, you must recognize the tag with the "AddTag" method. Only tags that have been AddTag can be operated within that object.
Values are added to the grid using the SetData method.
this.SetData(3, 0, vTag & "Comment")
The
notation means that the cell in row 0, column 3 should be set to a string that is the concatenation of the vTag variable string (the vTag variable stores the tag name, such as "T01") and the string "comment."
These numbers such as "3" and "0" are called "indexes" and are used to specify grid frame positions (cells). Indexes start at 0, and in this example, the value is stored in the first row and fourth column. If you specify "-1" as the index, it means the header row and header column.
In the above example, the for(condition){} statement performs a repeat process. This statement is just an example. Please adjust it according to the content you want to monitor in the list display.
|
The SetCellType("col", "meter", 1) statement is a method to specify the cell type. The cell type is specified as a string in the second argument. In this example, meter is specified. In addition to labels, there are also cell types that allow the value to be edited as an edit box. |
|
The statement SetCellProperty("col", "MeterForeColor", "#00FF00", 1) is a method for specifying cell properties. In this example, the meter color is specified. The properties that can be specified differ depending on the cell type. For details, refer to the Control Reference. |
|
Statements such as SetColWidth(0, 100) are methods for specifying the column width of a grid. In this case, it means that the width of column 0 (the first column from the left) will be 100 pixels. Feel free to adjust this value to suit the size of the control you are creating. |
6.Grid refresh script
Next, write a script to update the grid display. In this example, we will update the display automatically every time the tag value changes. For this process, we can use the OnTagValueChanged event. This event occurs every time the value of the tag added to the grid with AddTag changes.
Write the following script in the OnTagValueChanged event of Grid control.
event OnTagValueChanged(tagname,value) |
This completes the creation of the Analog List Form. Save the settings file after completing the steps above.
|
The OnTagValueChanged event has two parameters: “tagname” and “value”. tagname is the name of the tag where the change was detected, and value is the value of that tag. In the above example, the script is written as follows: |
Operation check
Check the operation of the analog list you created. Check while Panel Server is online.
1.Clicking the Panel Editor icon below will launch Panel Browser and open and run the client configuration file.

2.The analog list is displayed.
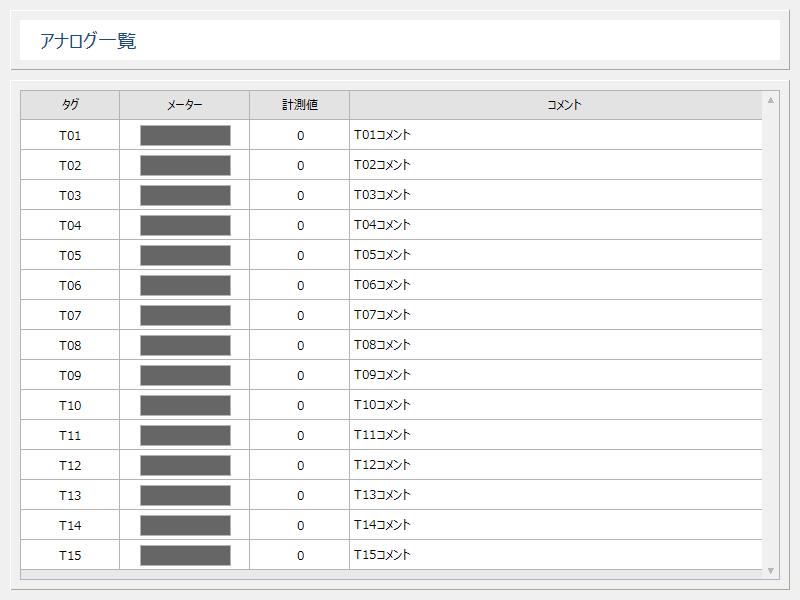
Try changing the value as desired from the
Panel Server tag monitor.
The following is an example where U01.F01.T01 is set to 50. If the measurement value shows 50 and the left half of the meter turns green, then it is OK.

|
The meter range displays values from 0 to 100 with 100% being the range. In this example, all tags are 0-100 so we didn't pay much attention to this, but if the analog value is in a range other than 0-100, you can call the "Math.LinearTrans" method to perform scale conversion before setting the value using the SetData method. Example) If the analog value is 0-300, convert it to 0-100 and pass it to the meter. |