What is missing data?
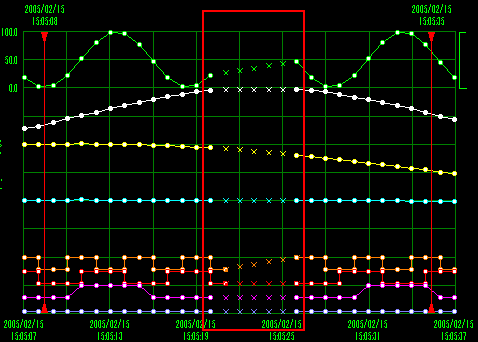
Missing log data refers to a situation where historical data logging was not possible due to some reason, resulting in missing data.
On the trend graph screen of FA-Panel, you can set the display method when log data is missing.
There are two ways of thinking about log data loss:
1)When the tag quality is abnormal (such as when a communication error occurs)
If the tag value cannot be trusted, such as when a communication error occurs with PLC, the tag quality flag will be "BAD".
For summary actions, NULL values are saved as missing values (for CSV, an empty string is saved).
Additionally, for logger actions, you can choose the logging behavior from the following:
1. Save the data with the previous value (last value) as the valid value.
2. Save NULL values and specified characters (including empty strings) as missing values.
3. Don't store data.
"1" saves the previous value (final value). "2" logs a pre-determined "missing value." The missing value can be freely determined, but it should be set to an unlikely value (such as -999999, or a specified string (including blanks)). "3" does not save the data at all. If you log the missing value of "2" in the logger action, or if you select "3" to not save the data, you must properly set how it should be displayed on the trend graph.
2)When the data itself does not exist (system down, etc.)
If Panel Server is stopped, the historical data will not contain any data for the time period during which it was stopped. In other words, if logging is set to occur at one-second intervals, for example, the time series data in the log data will be missing (gapped) for several seconds. Even in such cases, you must be aware of how to display the period for which no data is saved.
This section describes how to customize settings for how defects are displayed.
Customization details
•Display missing periods with dotted lines
Download the sample
The creation examples shown on this page are provided with samples.
The sample can be downloaded from below.
First, run the standard project and intentionally switch Panel Server online and offline to create missing periods in the log data and display them on a graph.
■ Operation verification (before changes)
1.Run the project
With your project open, click Online (yellow arrow) at the top of the Panel Server screen.
Click the browser run icon (green arrow) at the top of the Panel Editor screen to call up Panel Browser.

When Panel Browser starts, the trend graph screen will be displayed.
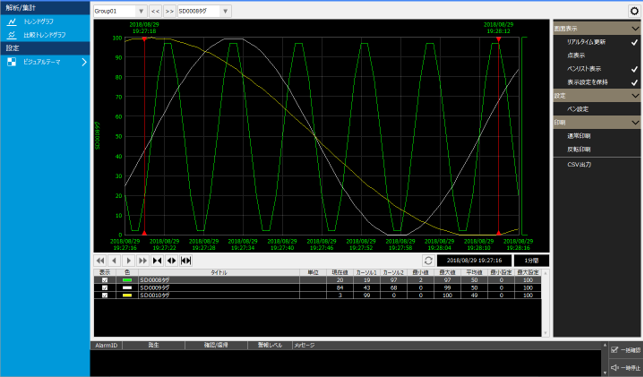
In the above example, a sine curve like the one above is displayed on the trend graph. In this example, the virtual device tags SD0008 to SD0015 have been pre-configured to log. The SD tag for virtual devices is a special tag called a "special register," and the values SD0008 to SD0015 automatically change in the range of 0 to 100 with a sine curve value. This tag is suitable for performing operation verification like this one.
2.Run the project
Now, let's intentionally stop logging and create a state where log data is missing.
Click Offline (black square) at the top of the Panel Server screen.
After about 10 seconds, click Panel Server online (yellow arrow) again.
If you look at the graph, you can see that the data for the period when Panel Server was offline is displayed as a straight line, as shown below.
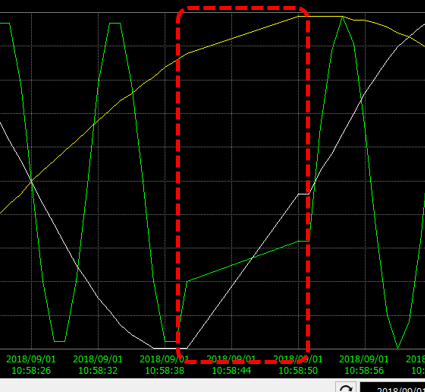
During this period, logging processing has stopped, so the log data itself is missing. Currently, a straight line connects the last point for which data exists and the first point where logging resumed.
How to handle the display of such missing parts can be customized by setting the properties of the Historical Data Graph Control placed on the trend graph screen.
The following procedure will customize the graph so that it does not display any missing periods.
■Editing the properties of Histrical data graph control
1.Edit the properties of Histrical data graph control
Please take the currently running Panel Server offline and terminate Panel Browser.
Edit the trend graph screen using Panel Editor.
|
From the workspace tree, select the "_Main" form in the _Trend folder.
|
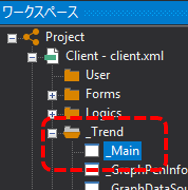
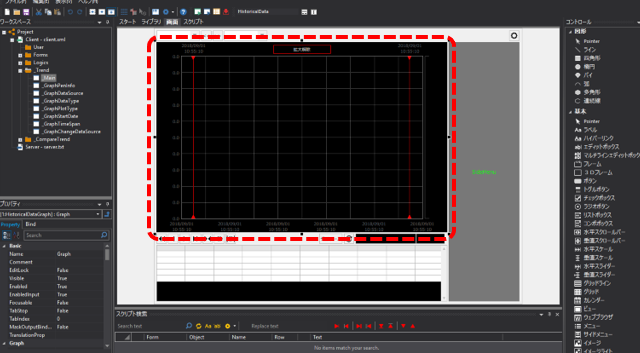
When the _Main form is displayed, select the graph component (Historical data control) located in the center of the form.
|
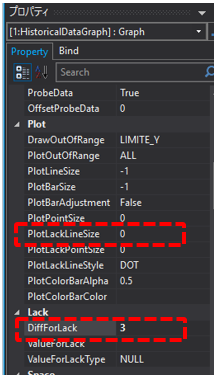
After selecting the control, edit the following properties from the property page displayed on the left side of the screen.
PlotLackLineSize The thickness of the line that displays missing data. Please set it to "0". Since it is set to "1" by default, specifying "0" will hide it.
DiffForLack Specify the data interval to be considered missing in seconds. In this example, enter "3". If the data interval is longer than the number of seconds specified here, it will be considered missing. The default is "0", so specify an appropriate number of seconds as necessary.
|
■ Operation verification (after changes)
1.Run the project
Please bring Panel Server online (yellow arrow) and run Panel Browser.
When Panel Browser starts, the trend graph screen will be displayed.
Let's intentionally stop logging and create a state where log data is missing.
First, click Offline (black square) at the top of the Panel Server screen.
After about 10 seconds, click Panel Server online (yellow arrow) again.
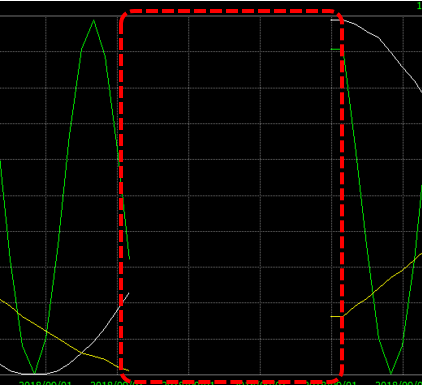
It's OK if the graph display for the period when Panel Server was offline is hidden as shown below.
Display missing periods with dotted lines
Next, we will introduce an example of customization that displays missing periods as dotted lines.
This customization can also be done by setting the properties of the Historical Data Graph control.
■Editing the properties of Histrical data graph control
1.Edit the properties of Histrical data graph control
Please take the currently running Panel Server offline and terminate Panel Browser.
Edit the trend graph screen using Panel Editor.
|
From the workspace tree, select the "_Main" form in the _Trend folder.
|
When the _Main form is displayed, select the graph component (Historical data control) located in the center of the form.
|
After selecting the control, edit the following properties from the property page displayed on the left side of the screen.
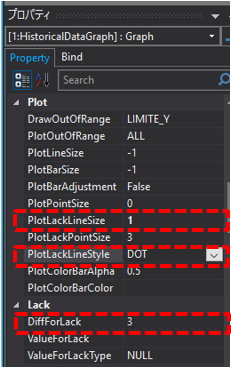
PlotLackLineSize The thickness of the line showing missing data. Set this to "1".
PlotLackLineStyle You can specify the line style for displaying missing data. Set "DOT" here. This will display missing periods as dotted lines.
DiffForLack Specify the data interval to be considered missing in seconds. In this example, enter "3".
|
■ Operation verification (after changes)
1.Run the project
Please bring Panel Server online (yellow arrow) and run Panel Browser.
When Panel Browser starts, the trend graph screen will be displayed.
Let's intentionally stop logging and create a state where log data is missing.
First, click Offline (black square) at the top of the Panel Server screen.
After about 10 seconds, click Panel Server online (yellow arrow) again.
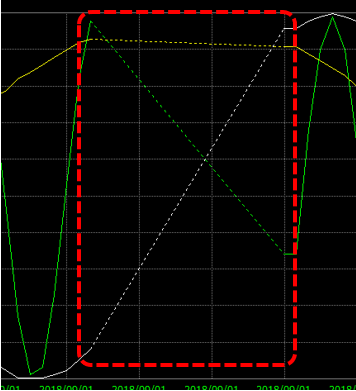
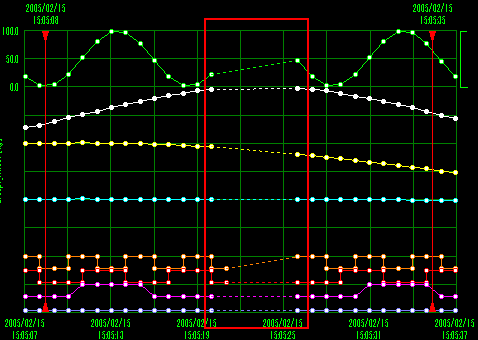
If the graph showing the period when Panel Server was offline is displayed as a dotted line as shown below, then everything is OK.
supplementary explanation
Histrical data graph control provides the following properties for how missing data is displayed in trend graphs.
Properties |
overview |
||||||||
PlotLackLineSize
|
The thickness of the line that displays missing data. The default is "1". Specify "0" to hide it. |
||||||||
PlotLackPointSize
|
You can specify the size of the points to display for missing data. The default is "0". Points will be displayed if you set it to 1 or more (if you want to display them, we recommend about 4). |
||||||||
PlotLackLineStyle
|
The style of missing data line display. You can choose from SOLID, DASH, DOT, DASHDOT, DASHDOTDOT. |
||||||||
DiffForLack
|
Set the time interval in seconds that will be considered as a gap in historical data. If there is a gap in the data that is more than the number of seconds set here, it will be considered missing.
For example, if sampling is performed at one-minute intervals, setting DiffForLack to 90 will cause data intervals of 90 seconds or more to be considered missing. This will cause the display of this period to be treated as missing.
|
||||||||
ValueForLack
|
You can specify the value to be considered as missing. Use this in conjunction with the ValueForLackType property below.
For example, if you want to treat the number "-1" as a missing value, set it as follows:
ValueForLack : -1 ValueForLackType : NUM
|
||||||||
ValueForLackType
|
Specify the type of value to be considered as missing. The default is "NULL".
|


Below are some example settings (note that in either case, you must set DiffForLack to an appropriate value).
|
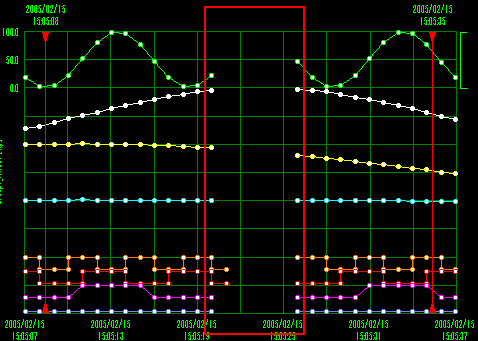
If you don't want to display anything during the missing period, set it as follows:
PlotLackLineSize : 0 PlotLackPointSize: 0
|
|
If you want to connect missing periods with dotted lines, set it as follows.
PlotLackLineSize : 1 PlotLackLineType: DOT
|
|
If you want to plot the missing data for the missing periods as predicted values, set it as follows:
PlotLackPointSize: 4
*Dots are displayed with a value of 1 or more, but if you specify a size that is too small, they will be indistinguishable from lines, so we recommend a setting of around 4 to 6.
|