overview
If you need to display long-term log data on a trend graph, you should mainly consider the following specifications:
Points to consider |
Contents |
Log data collection cycle
|
The log data collection period, such as 1 second, 1 minute, etc. The shorter the period, the more data will be collected within the specified period. |
Display span on graph
|
Consider the display span for the above log data on the graph. For example, consider in advance whether you need to display only one hour, one day (24 hours), or more.
|
When displaying log data on a trend graph, the internal process involves retrieving the log data to be displayed from Panel Server and plotting the points on the graph. Therefore, the processing load on the monitoring screen system will vary depending on how many points need to be plotted on the screen as a graph.
For example, if you want to display log data with one-second intervals as a graph over a 12-hour display range, the data is one item per second, so the amount of data per pen will be 43,200 items.
60 (seconds) * 60 (minutes) * 12 (hours) = 43,200 items
Based on the above concepts, this section explains how to set up a trend graph to display long-term data.
Download the sample
The creation examples shown on this page are provided with samples.
The sample can be downloaded from below.
The sample project contains the following log data as test data. When verifying the history display, specify a date that falls within the following range.
•RAW data: Log data at 1-second intervals from 2018/9/10 to 2018/9/24
Adjusting the data display period
The standard settings of the screen library are preset to display long-term data by default. The data display period of the trend graph can be adjusted by setting the following properties of the "Historical Data Graph Control".
Property Name |
Contents |
||||||
_HDSDataMax
|
Specify the maximum number of data points per pen to be displayed on the trend graph. By limiting the maximum number of data points for display requests, you can reduce the processing load (screen library default setting: 50,000). This property is a custom property provided in the trend graph screen library, but it can also be set by directly editing the "HDSDataMax" property of the historical data graph control placed on the trend graph screen. |
||||||
RealTimeUpdateMode
|
Specify the data acquisition method when in real-time display mode. You can select from the following (screen library default setting: ALL).
This property is available in the historical data graph control placed on the trend graph screen.
|
||||||
HistoricalUpdateMode
|
Specify the data acquisition method when in historical display mode. You can select from the following (default setting of the display library: ALL).
This property is available in the historical data graph control placed on the trend graph screen.
|
||||||
UpdateCounterMax
|
When RealtimeUpdateMode or HistoricalUpdateMode is ALL, specifies the upper limit of the number of times to request the server to split the log data (screen library default setting: 10). |
■ Check the default settings
In the Trend Graph Screen Library, the properties of the Historical Data Graph control are set as follows by default:
•_HDSDataMax: 50,000
•RealTimeUpdateMode: ALL
•HistoricalUpdateMode: ALL
•UpdateCounterMax: 10
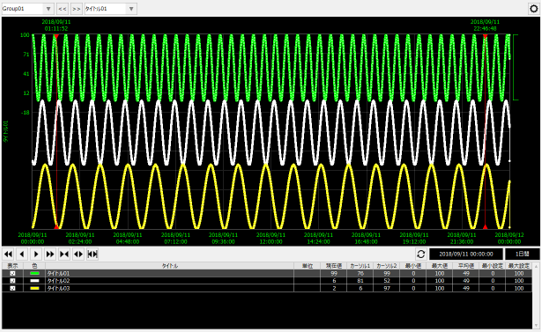
Make sure the project is online and check "Real-time updates" in the graph display mode.
If you set the display period to one day, all the data will be displayed as shown below.
Next, change the display period to 5 days.
The graph on the screen will then display 50,000 items at intervals of a few seconds.
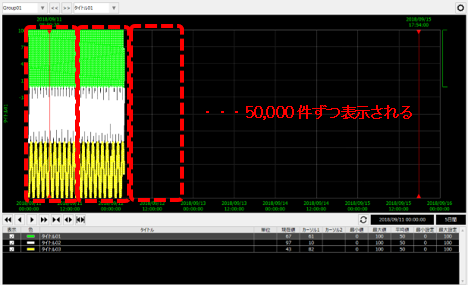
Finally, all data for five days was displayed.
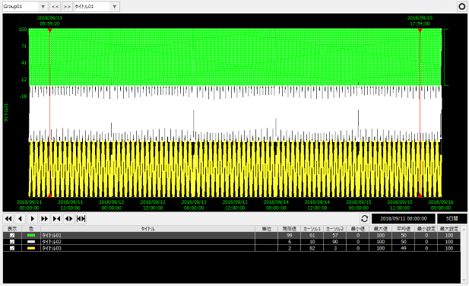
The above behavior is when RealTimeUpdateMode is set to "ALL". Even if a long period is specified for the display period in real time, a lot of data can be displayed on the graph.
Please note that in the case of real-time display, depending on the data display period and the number of data items, it may take some time for processing to display all the data. Specifically, it takes time for the graph to be initially displayed each time the screen display is called up or the pen group is changed. In cases where you want to use the trend graph screen mainly for real-time display, you will need to confirm the user needs within how many seconds the initial display of the graph needs to be completed, and then adjust the _HDSDataMax and RealTimeUpdateMode settings to a range that matches the needs, or take care not to specify a long period as the display period during operation.
Next, uncheck "Real-time updates" in the graph display mode, change the display period to 5 days, and specify the date and time as 2018/9/12 00:00:00.
Then, every few seconds, 50,000 items will be added at a time, and eventually all the data will be displayed.
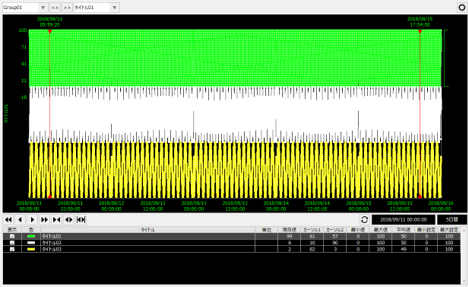
The above behavior is when HistoricalUpdateMode is set to "ALL". Even if a long period is specified as the display period when displaying history, a lot of data can be displayed on the graph.
The following describes the behavior when each property is changed using specific examples.
■Verification of RealTimeUpdateMode/HistoricalUpdateMode operation
As an example, change the properties of the Historical Data Graph control as follows:
•_HDSDataMax: 50,000
•RealTimeUpdateMode: NEW
•HistoricalUpdateMode: OLD
•UpdateCounterMax: 10
When displaying historical data with the above settings, the graph will only display up to the maximum number of 50,000 records from the start of the log data search. Also, in real-time display, data older than the most recent 50,000 records will not be displayed in the graph.
Let's check how it actually works.
1.Run the project
Click Online (yellow arrow) at the top of the Panel Server screen.
Next, click on the browser run icon (green arrow) at the top of the Panel Editor screen to call up Panel Browser.
Once Panel Browser is launched, display the trend graph screen.
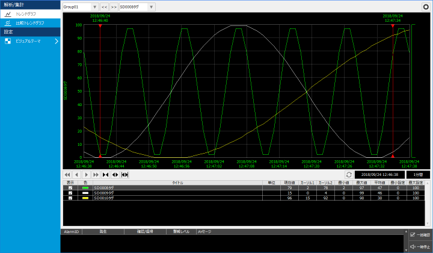
The default display setting for the trend graph screen is to display a 10 minute period. In the example above, all data during the period is displayed as a graph.
2.Try changing the display period to "1 day"
Now, try changing the graph display period to "1 day."
Then, you will see that only the right half of the graph will be displayed, and the graph will not show any data beyond that point.
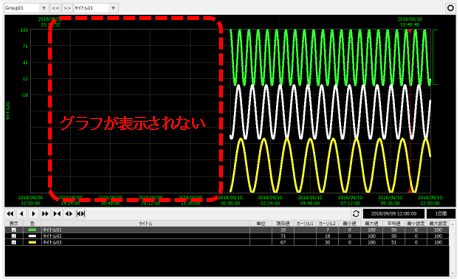
In the above example, _HDSDataMax is "50,000" and RealTimeUpdateMode is "NEW", so only the most recent 50,000 pieces of data are displayed.
3.Try changing the display mode to History view.
Click the settings button (gear icon) on the right side of the trend graph screen to display the menu, uncheck "Real-time updates," and set the date and time to 2018/9/12 00:00:00.
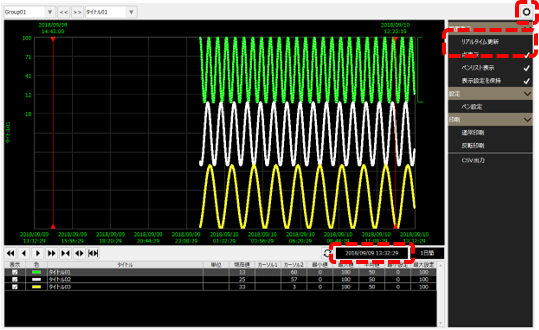
Even though the sample data contains 24 hours' worth of data, the graph only displays the oldest data in the display period (the left side of the graph) and the top 50,000 data items toward the present, and no data beyond that is displayed.
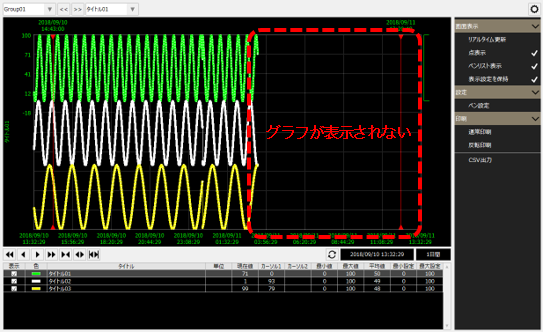
In the above example, _HDSDataMax is "50,000" and HistoricalUpdateMode is "OLD", so only 50,000 pieces of data from the start of the specified period are displayed.
Customize the display period dialog
On the trend graph screen, you can display a dialog box for selecting the display period by clicking the span (display period) displayed in the lower right corner of the graph.
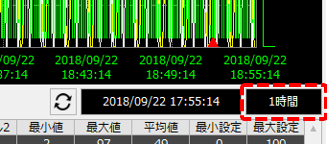
(Display period dialog)
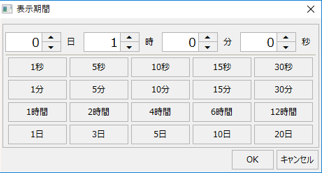
In this dialog, you can specify the display period by using buttons for each display unit, such as 1 second, 1 minute, etc., or spin buttons for days, hours, minutes, and seconds.
By default, this dialog allows you to specify a period of up to 20 days in day units, but if you do not need such a long display span, or if you want to prohibit the specification of long spans as a system, you can customize this dialog.
■Editing the display period dialog
1.Open the Display Period dialog
From the workspace, open the "_Trend" folder and select "_GraphTimeSpan".
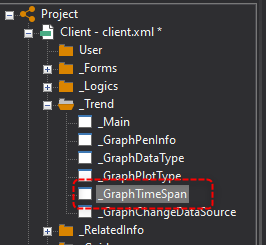
Then, the display period dialog form was displayed.
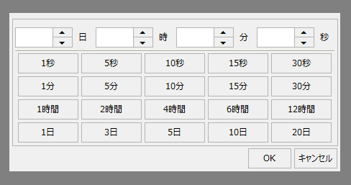
2.Edit Display Period Dialog
For example, if you want the range that can be specified from the screen to be limited to time units, the easiest way to do this is to hide the buttons that are the targets of operations.
While holding down the Control key, click each control you want to hide to select it.
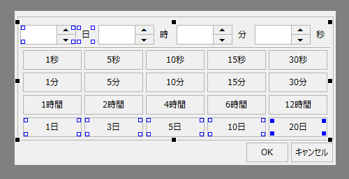
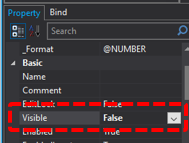
With the control selected, go to the property page on the left of the screen and change the "Visible" property to "False".
3.Operation check
Click Online (yellow arrow) at the top of the Panel Server screen.
Next, click on the browser run icon (green arrow) at the top of the Panel Editor screen to call up Panel Browser.
Try displaying the display period dialog from the trend graph screen.
It's OK if each object you changed in the steps above is hidden as shown below.
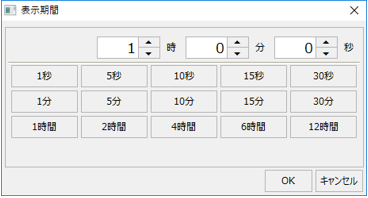
|
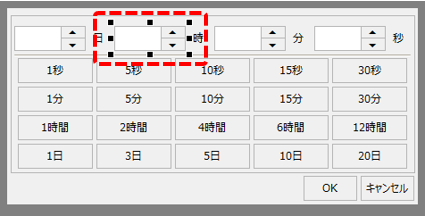
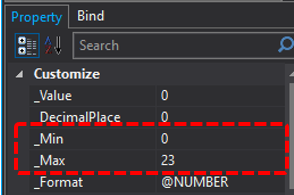
Normally, when entering "hours," you can specify the time in the range from 0:00 to 23:00. If you want to only allow time units up to 12 hours, you can edit it as follows.
First, select the object you want to edit.
From the property page on the left side of the screen, display the custom properties "_Min" and "_Max". These are parameters that specify the range of values that can be entered by entering numbers. For example, by setting "_Min" to 0 and "_Max" to 12, only values between 0 and 12 can be entered.
Currently, this dialog is designed so that you can only specify up to 20 days. If you need to specify a period longer than 20 days, you can change the input conditions in the day edit box and customize it to specify a longer period by copying a button such as "20 days."
|