overview
Another way to display long-term data on a trend graph is to display aggregate data, such as daily reports, on the graph.
In the case of summary actions, a periodic log of RAW data is normally displayed on the graph, but by configuring the appropriate properties on the trend graph screen, it is possible to automatically switch the reference for the data to be displayed from among raw data, daily report aggregated data, monthly report aggregated data, yearly report aggregated data, etc., depending on the length of the graph's display period (display span).
Summary actions also allow you to freely add units for the aggregation process. The standard framework provides three aggregation units: daily report aggregation (hourly aggregation), monthly report aggregation (daily aggregation), and yearly report aggregation (monthly aggregation), but you can also add new aggregation units such as 10-minute and 30-minute units. By using this aggregation function to aggregate raw data into any aggregation unit, you can display long-term data on a graph after thinning it out.
In this section, we will introduce how to set up the system to switch the reference to aggregated data depending on the display period, and how to add an aggregation unit for summary actions.
Download the sample
The creation examples shown on this page are provided with samples.
The sample can be downloaded from below.
The sample project includes the following data as test data. When verifying the history display, specify a date that falls within the following range.
•RAW data: Log data with 1 second intervals from 2018/9/10 to 2018/9/24
•Daily report data: Daily report data from 9/10/2018 to 9/24/2018. Daily report data is data that is compiled on an hourly basis based on RAW data, and is compiled into 24-hour records with one record per hour.
Displaying daily report summary data in a graph
This section describes how to automatically switch the data source reference to be displayed between raw data (RAW data), daily report summary data, monthly report summary data, and annual report summary data depending on the length of the graph display period (display span).
This setting is made for the following properties provided as the trend graph screen library.
Property Name |
Contents |
_ChangeSpanMode
|
Set whether to automatically switch the data source reference destination. If you set this property to True, automatic switching is enabled. (Default setting: False)
Furthermore, the automatic switching process is performed according to the settings of the related properties "_ChangeSpan" and "_ChangeSpanDataName" below.
|
_ChangeSpan
|
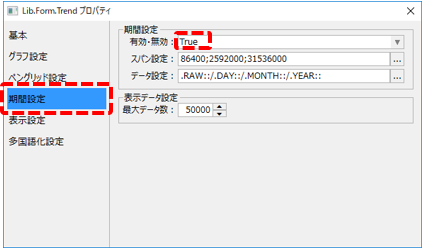
When "_ChangeSpanMode" is True, sets the span period for switching data sources. (Default settings: 86400;2592000;31536000)
The setting is in seconds, and the period is separated by a ";" (half-width semicolon). The default behavior is that if the span is 1 day or more, 30 days or more, or 365 days or more, the connection will automatically switch to the data source set in "_ChangeSpanDataName".
|
_ChangeSpanDataName
|
When "_ChangeSpanMode" is True, set the data source string to be automatically switched. (Default setting: .RAW::/.DAY::/.MONTH::/.YEAR::)
When setting this property, you specify the connection destination information that will be switched depending on the period specified by "_ChangeSpan" by enumerating the source and destination strings.
|
The following explains this using specific examples.
■ Property editing
1.Set the properties required for automatic switching
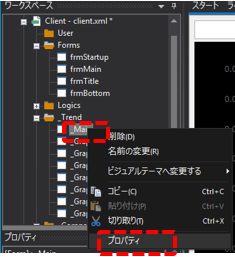
From Panel Editor, right-click the "_Main" form in the _Trend folder to display the menu, and select "Properties" from the menu.
The properties dialog will appear, so change the "Enabled/Disabled" setting in the period setting to "True" (this setting is the _ChangeSpanMode property).
2.Operation check
Click Online (yellow arrow) at the top of the Panel Server screen.
Next, click on the browser run icon (green arrow) at the top of the Panel Editor screen to call up Panel Browser.
Once Panel Browser is launched, display the trend graph screen.
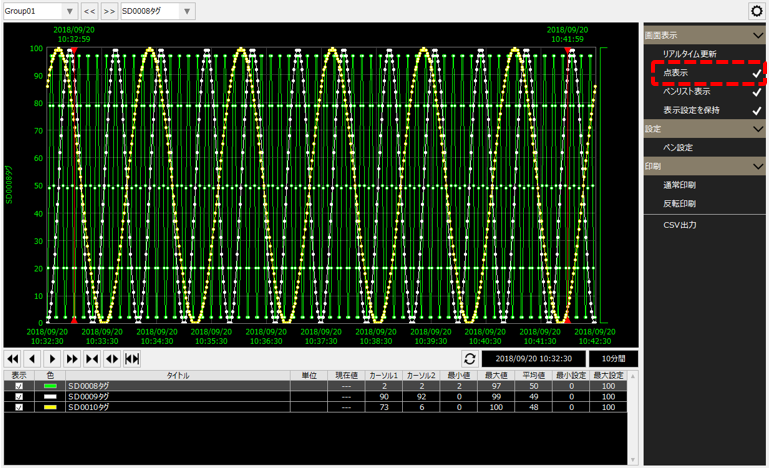
For example, the history display mode is set to 10 minutes, and "Point display" is enabled. In addition, the date and time is specified as a date and time when historical data exists as sample data (e.g. 2018/9/12 0:00:00).
When the graph display period was changed to 3 days, the graph display changed as follows:
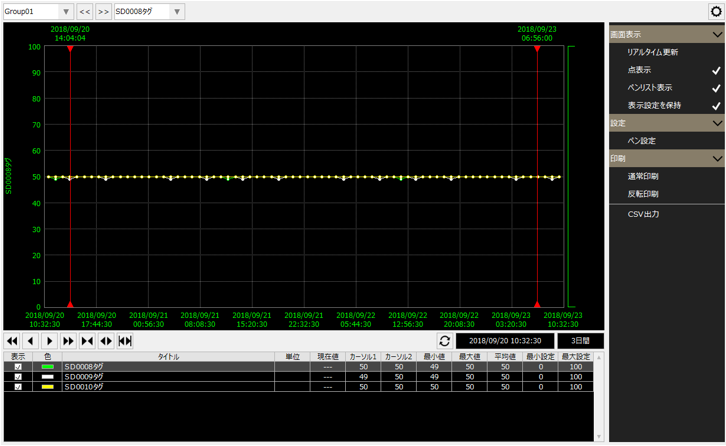
The above behavior occurs because the daily report summary data is automatically referenced and displayed when a display period of one day or more (less than 30 days) is specified.
In this way, trend graphs can be configured to display aggregated data depending on the length of the display period.
|
In the above example, _ChangeSpan is set to "86400;2592000;31536000". With this setting, if the display period is 1 day or more, it will automatically switch to refer to daily report data, if it is 30 days or more, it will automatically switch to refer to monthly report data, and if it is 365 days or more, it will automatically switch to refer to annual report data.
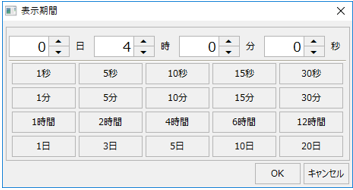
However, in the standard display period dialog, the maximum number of days that can be specified for the span is 20 days, and as is, it is not possible to specify a number of days beyond that. If you need to specify a display span of 30 days or more, you can do so by customizing the display period dialog, such as by adding a button to the period specification.
(Display period dialog)
|

Add 10-minute aggregations and display them on the graph
This article explains how to add aggregation processing of any unit to the summary actions that are pre-installed in standard projects.
In the default settings of a standard project, three aggregation processes are pre-defined: daily report aggregation, monthly report aggregation, and yearly report aggregation. Here, we will add a new aggregation process in 10-minute intervals.
1.Edit summary master
Add settings for 10-minute aggregation to the summary master.
Open "master.txt" in the following folder of the project using Notepad or similar.
(Project folder) \server\summary\master.txt
Add the following section to the summary master aggregation log definition (it is a good idea to add it at the beginning of the aggregation log definition, before the [RAW::DAY] section).
(Editing contents)
[RAW::10MIN] CsvFileName=DB\10MIN\SMR_10MIN_.csv CsvFileUnit=DAY SummaryType=[SummaryType1] SummaryParam=[SummaryParam1] SummaryUnit=10MIN
|
(Example of editing in Notepad)
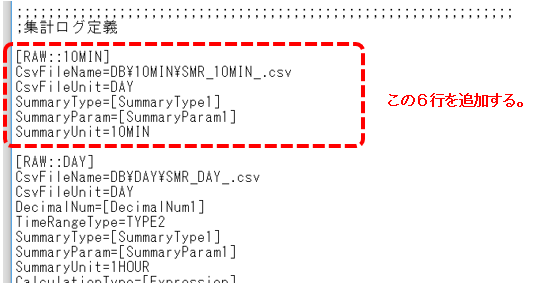
The above definition means that the data is compiled in 10-minute increments based on RAW.
Also, the data source identification name will be "10MIN".
This completes the settings. Save the summary master.
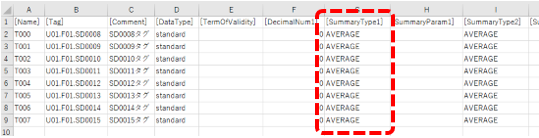
The type of aggregation process for each column is determined according to the contents of the "SummaryType1" column of the tag field master "fieldmaster_tag.csv". Since "AVERAGE" is set in the tag field master for this sample, the operation will calculate the average value for 10 minutes.
(SummaryType1 column of fieldmaster_tag.csv)
2.Operation check
Click Online (yellow arrow) at the top of the Panel Server screen. Please note that you will need to take Panel Server offline once and then online again to reflect the changes to the Summary Master settings.
Next, click on the browser run icon (green arrow) at the top of the Panel Editor screen to call up Panel Browser.
When the trend graph screen is displayed, display the pen settings dialog from the settings menu.
As an example, create a new group called "Group02", add a new pen, and display the pen data source selection.
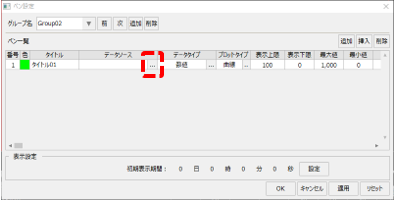
When the data source selection dialog appears, make sure that the "10MIN" data source you just added is displayed in the list, and select any one of the 10MIN data.
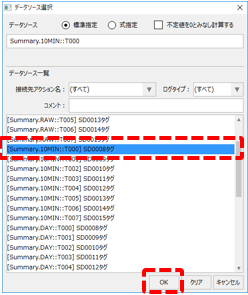
Once you have selected the data source, click the OK button in the Pen Settings dialog to close the settings.
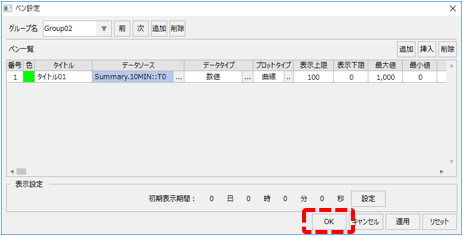
On the trend graph screen, change the pen group to "Group02" and change the display period to 4 hours.
You will then see that the 10-minute summary data is now displayed in the pen you just added.
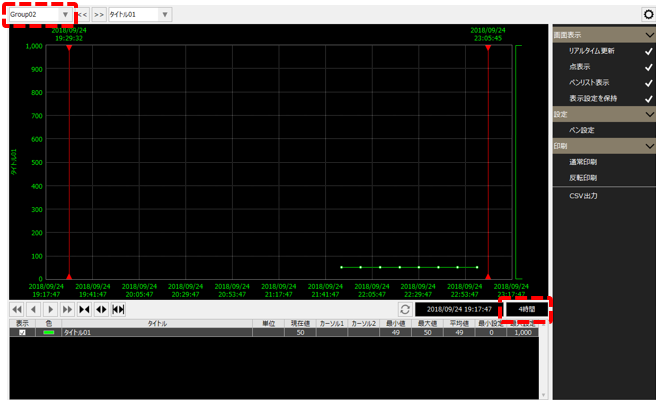
In addition, 10-minute calculations are performed every 10 minutes (0 minutes, 10 minutes, 20 minutes, 30 minutes, 40 minutes, and 50 minutes after every hour). Data will not be displayed on the graph until calculations are actually performed. If no data is displayed, please wait a while and check again.