Comparative trend graph screen operations
This section explains the basic screen operations for the comparative trend graph.
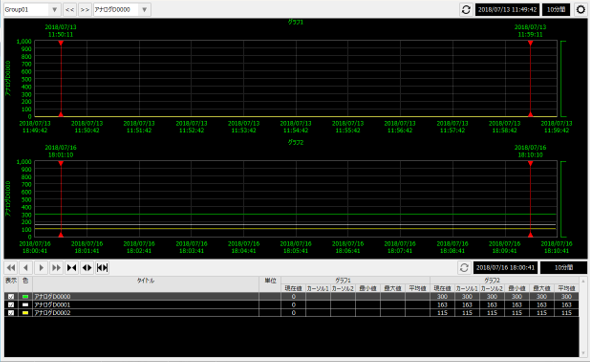
The operation method of the comparison trend graph is similar to that of the trend graph. In addition, the pen settings such as pen groups are reflected in common with the pen settings of the trend graph. For details on the screen operation of the trend graph, please refer to "Screen Operation of the Trend Graph".
Here we will only explain the operation methods specific to the comparison trend.
■ Changing the comparison method for the graph
Check "Vertical Comparison" in the settings menu to display the graphs side by side.
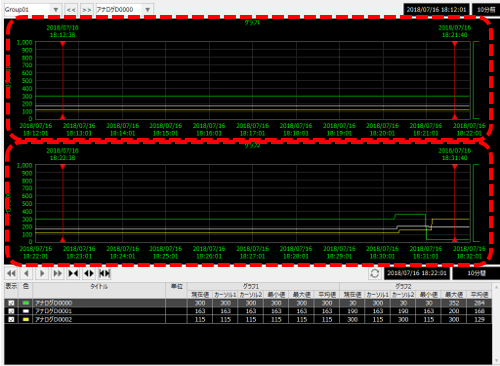
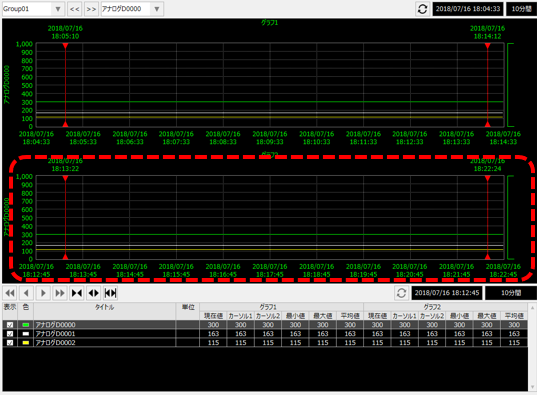
In this mode, two time series graphs can be displayed at the top (Graph 1) and bottom (Graph 2) of the screen with the same pen group display.
|
The lower graph displays the source data, and the upper graph displays the target data.
The display period and start date and time can be manipulated for each of the upper and lower graphs.
|

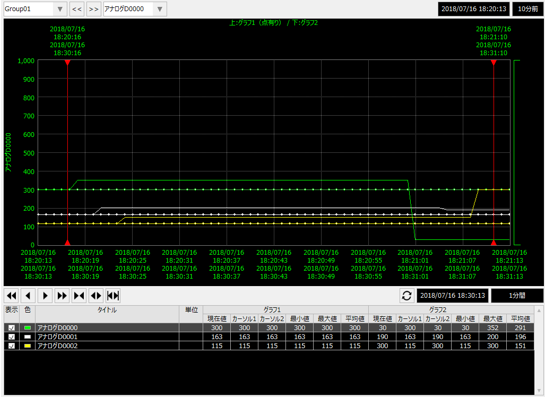
If you uncheck "Vertical Comparison" from the settings menu, the graphs will be displayed overlapping each other.
|
When graphs are overlaid, the graph of the comparison data displayed on top is displayed as points, making it possible to visually distinguish it from the comparison source data.
|
■ Switch between real-time and history display
You can switch between real-time and history display each time you click "Real-time update" from the settings menu.
|
Normally, with real-time updates, only the graph at the bottom of the screen scrolls in real time.
|
■ Graph linking operations
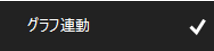
By checking "Graph Link" in the settings menu, the graph at the top of the screen will scroll in sync with real-time updates of the graph at the bottom of the screen.
|
When graphs are linked, the data displayed in the upper graph is retrieved according to the display period setting at the top of the screen and displayed in conjunction.
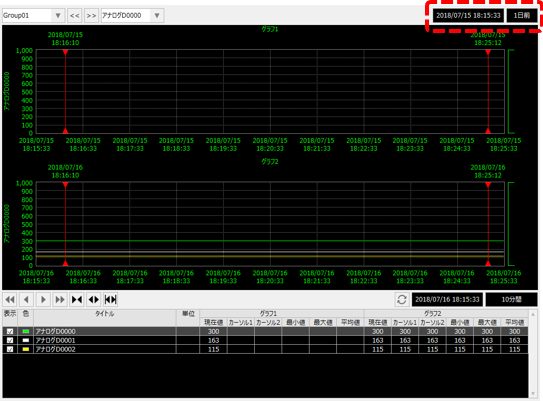
In the above example, data from one day ago is automatically retrieved and displayed. You can freely change this setting by clicking the above. For example, you can specify an offset time such as displaying data from five minutes ago or one day ago.
|