Operation monitoring screen library
The operation monitoring function is provided as a screen library. By simply configuring the necessary settings using the operation monitoring screen library, you can monitor the operation of equipment.
Screen Library Types |
overview |
This is a screen library for operation monitoring.
The operation monitoring screen library contains a complete set of screen functions related to operation monitoring.
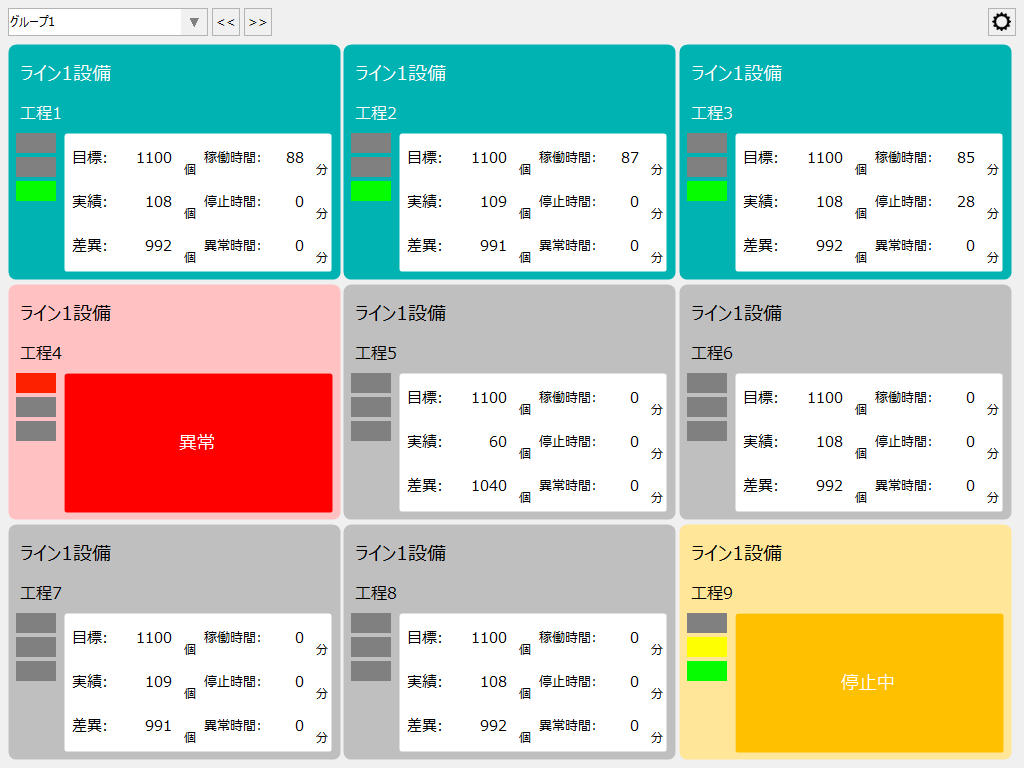
(Operation status monitor)
|
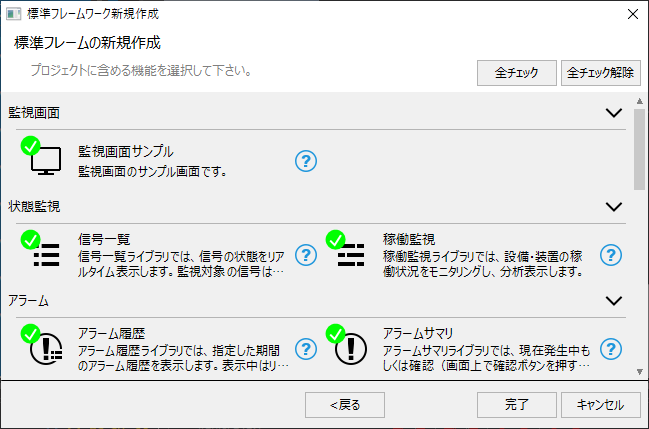
When using an operation monitoring screen library, you can automatically generate a project with the required screen library incorporated by selecting Operation Monitoring from the standard framework wizard screen.
(Standard framework wizard screen)
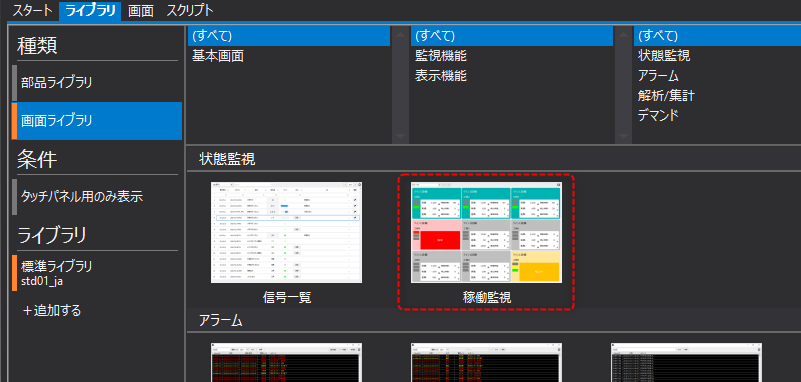
Alternatively, you can manually include and use the desired screen library from the Libraries tab in Panel Editor.
(Library tab in Panel Editor)
Main screens of the operation monitoring screen library
The operation monitoring screen library includes all of the following screens:
Screen Name |
Screen image |
overview |
Operation status monitor
|
|
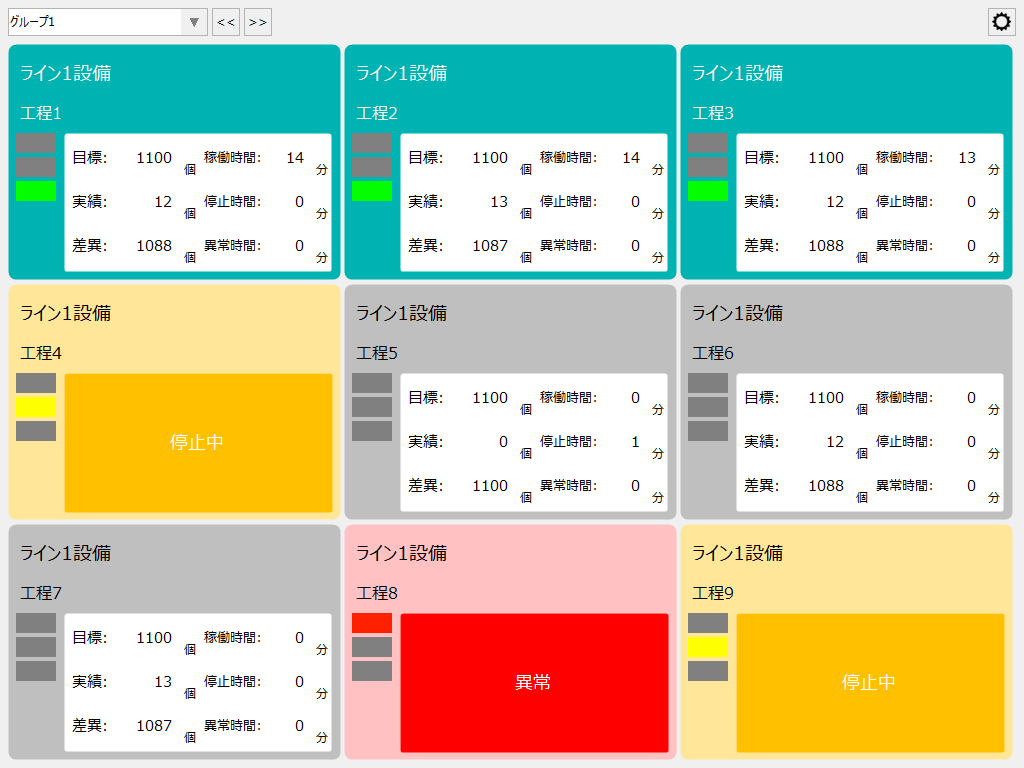
The operation status monitor screen is used to monitor and display the current operation status of equipment in real time on screen.
It is possible to display multiple equipment display frames side by side on the screen, a so-called "Andon display." The layout of the display frames and the data items displayed within the frames can be flexibly changed. |
Timeline
|
|
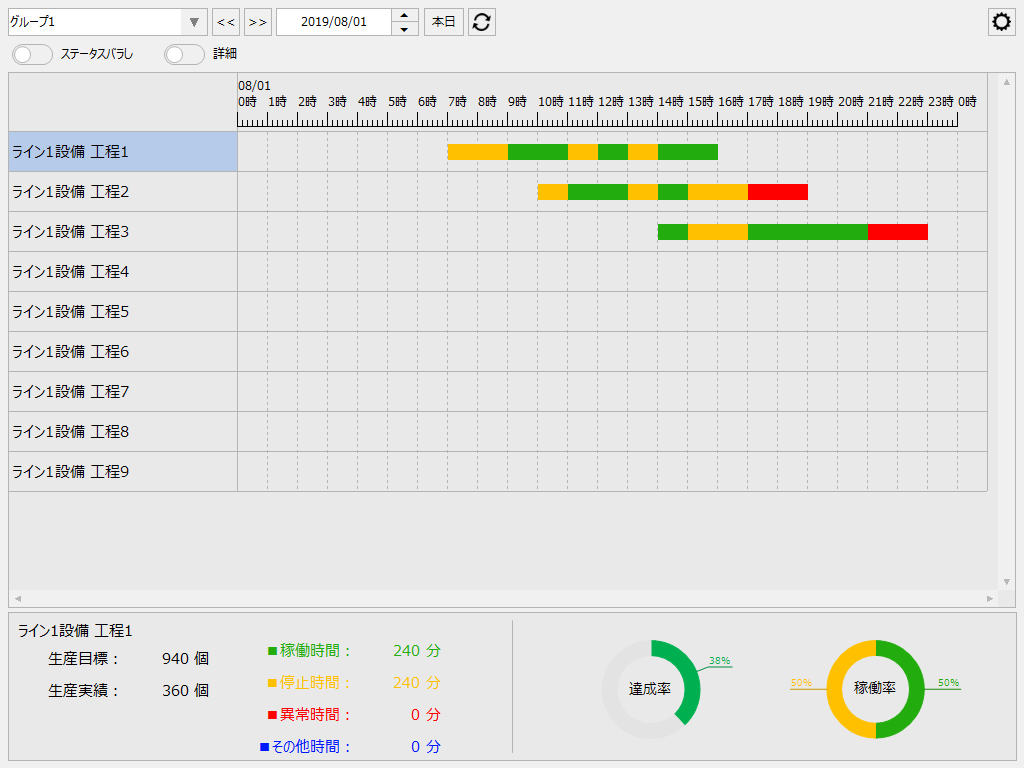
The Timeline screen is used to display the operation status of equipment, such as operation and shutdown, as a chronological Gantt chart.
Select any date and group from the screen, and the equipment registered in the target group will be displayed vertically, color-coded according to operating time, stopped time, abnormal time, other time, etc., in a Gantt chart.
|
Operational track record
|
|
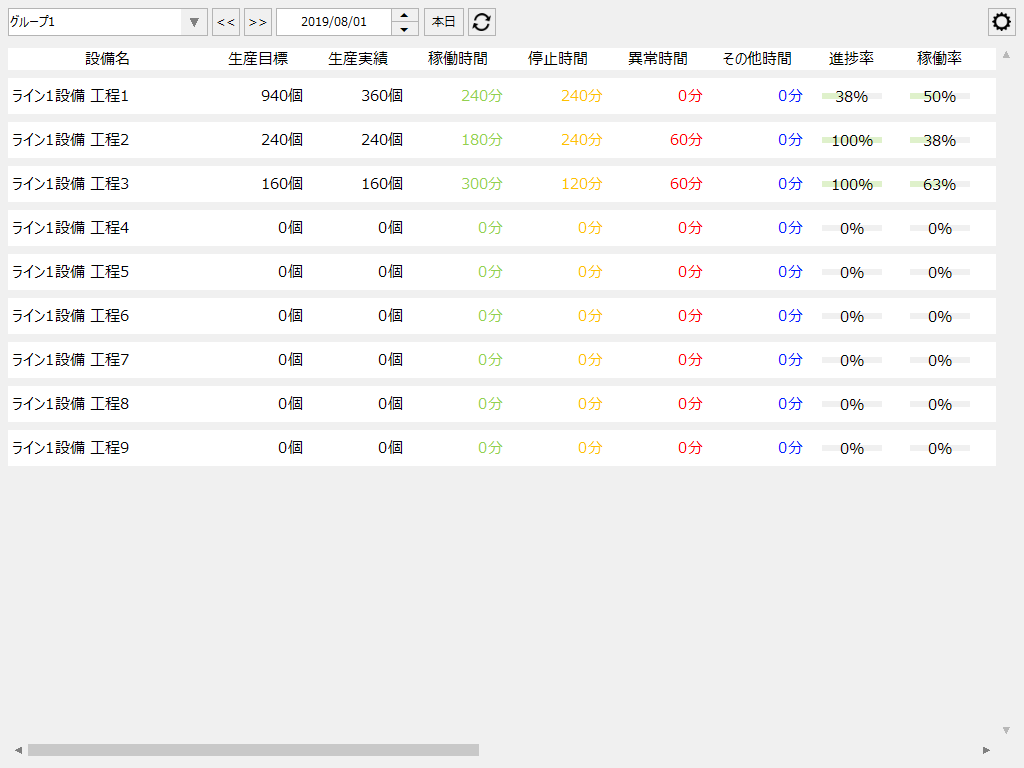
The operation record screen is used to display the operation record of equipment in a list format.
You can select any date and group from the screen, and display in a list format the operation time, stop time, number of operations, number of stops, number of abnormalities, and other aggregated values, as well as the operating rate, production target, production results, and progress rate for each piece of equipment registered in the target group.
|
Operation Analysis
|
|
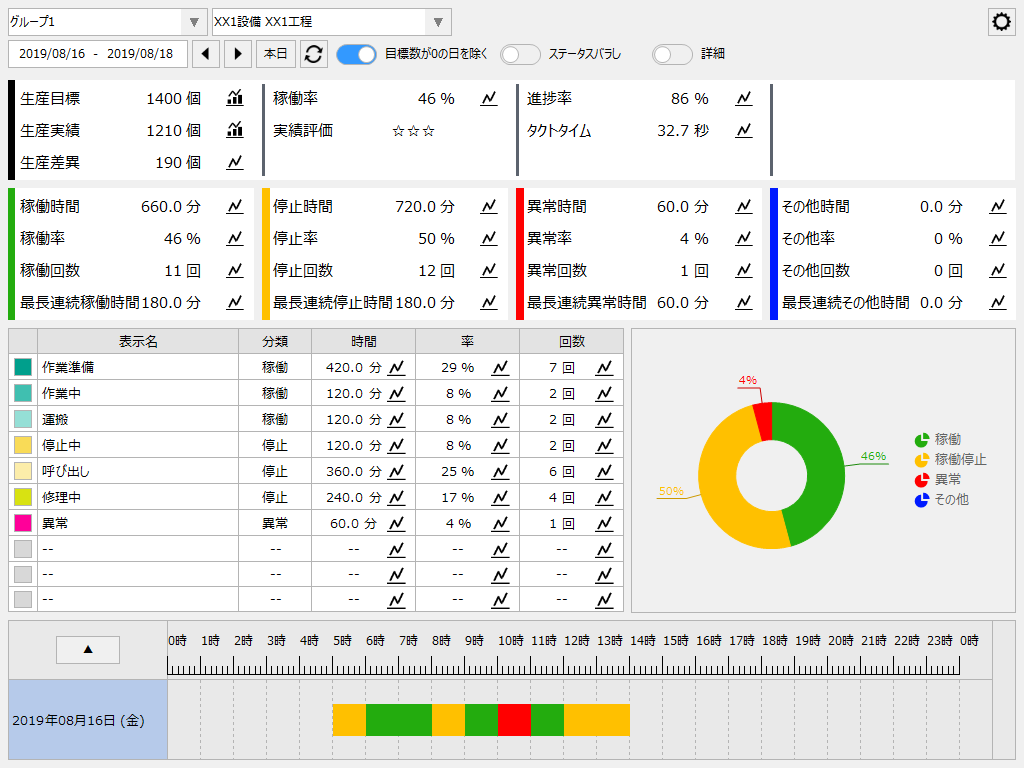
The operation analysis screen is used to display detailed operation performance data for equipment.
You can select any date and equipment from the screen to display the operation time, stop time, and other time summary values for the equipment, detailed breakdown of each time summary, operation count, stop count, abnormality count, and other count summary values, operation rate, etc. You can also display production targets, results, and progress rates by setting production targets and production performance collection.
In addition, this screen allows you to specify a range of multiple dates to display, and the data for the specified date range can be aggregated and displayed.
|
Monthly Report Timeline
|
|
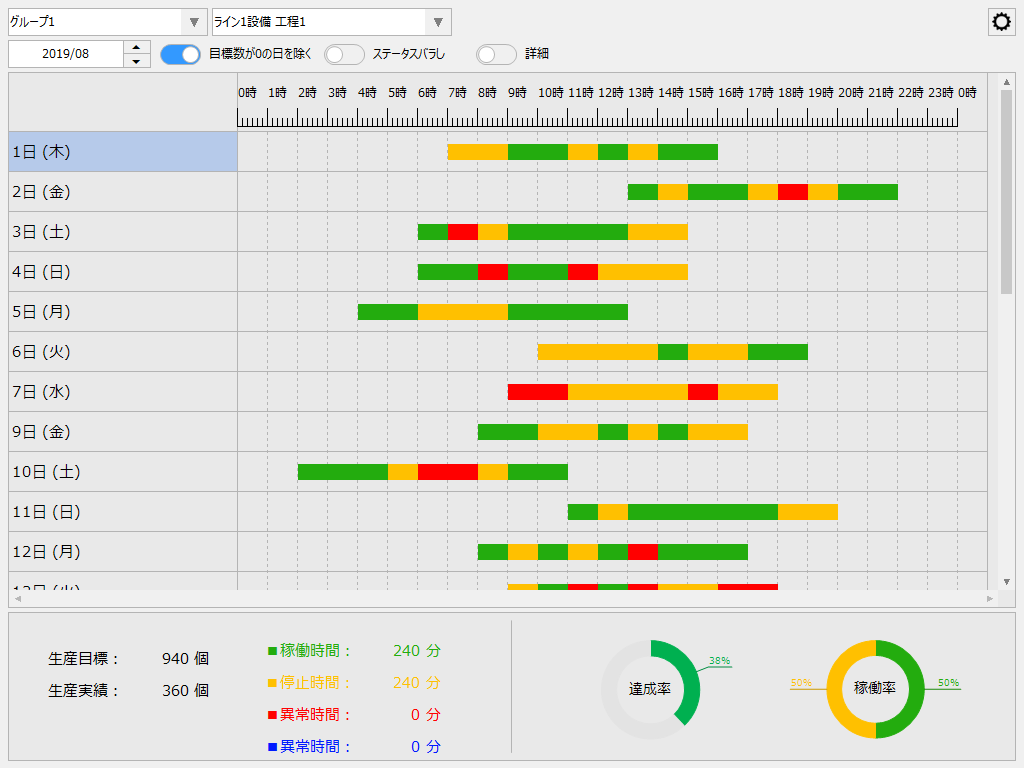
The Monthly Report Timeline screen is used to display the operation status of the equipment selected on the screen for one month in a Gantt chart.
The Gantt chart displays the operation status of the equipment, such as operation time and stop time, for the year and month selected on the screen, arranged one line per day for one month.
|
Monthly operation results
|
|
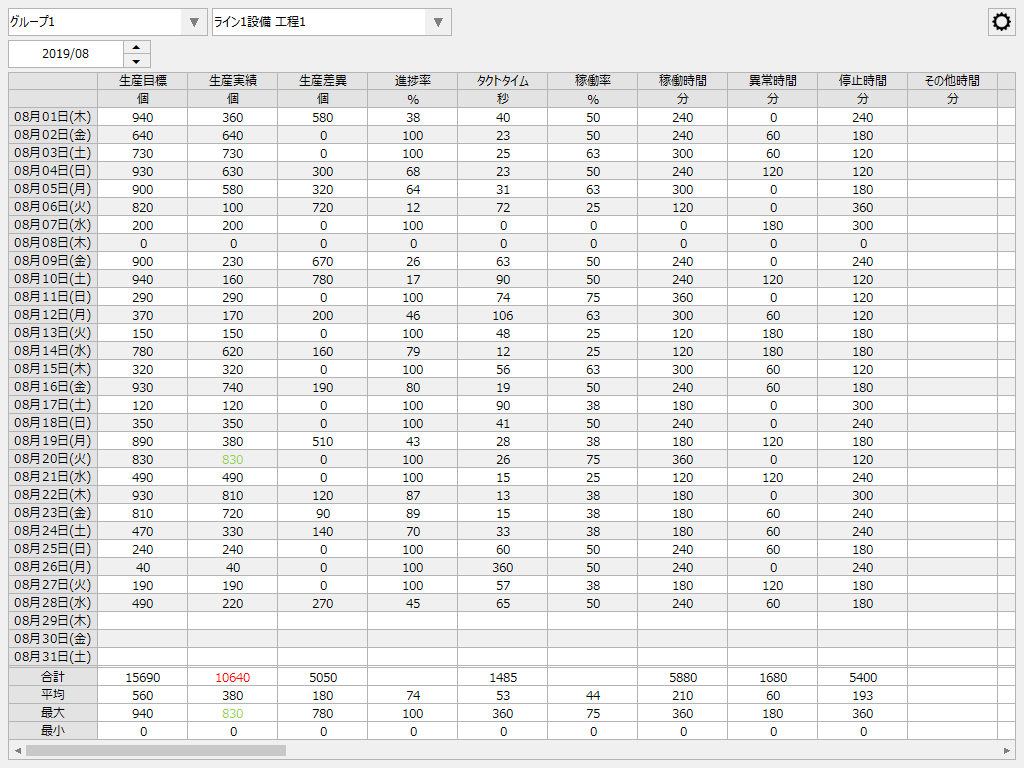
The monthly operation results screen is a monthly report screen of the equipment operation results.
The daily operating status summary values for the year, month, and equipment selected from the screen are displayed on a grid. Monthly data can be printed as a monthly report or saved to a CSV file.
|
Monthly Bar Graph
|
|
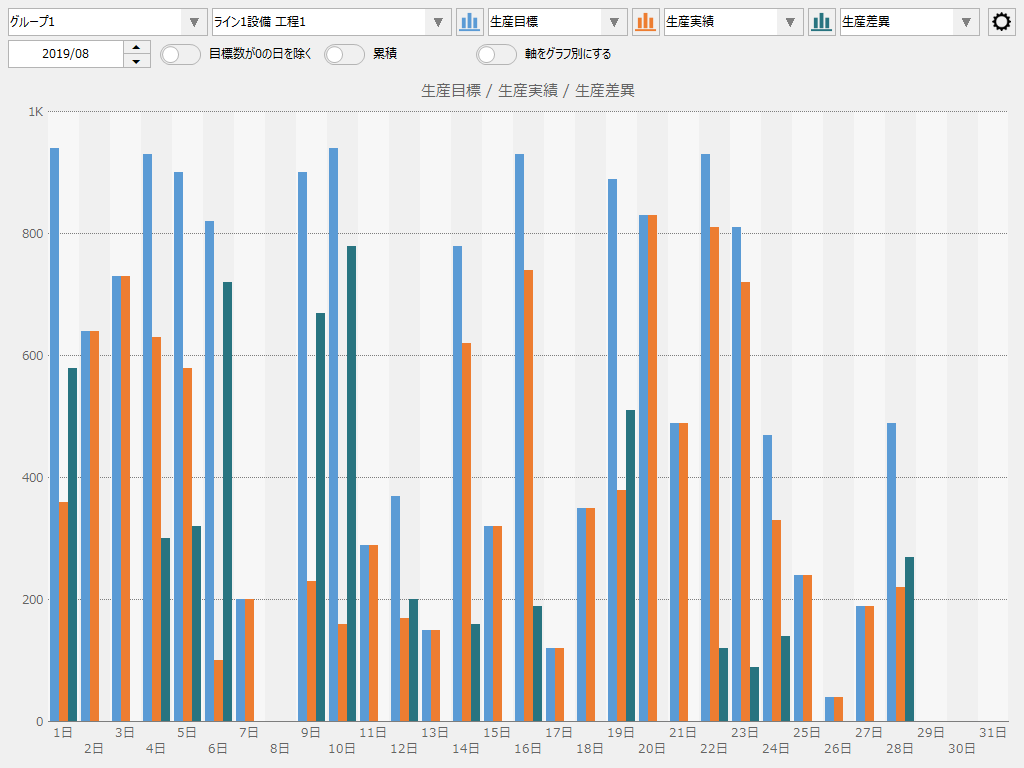
The monthly report bar graph screen displays the equipment operation results on a monthly basis as a bar graph.
The aggregated operating status values for the year, month, and equipment selected from the screen are displayed side by side in up to three bar graphs. The data displayed in the graph can be freely selected from various aggregated data such as production targets, production results, operation time, and downtime.
|
Monthly stacked graph
|
|
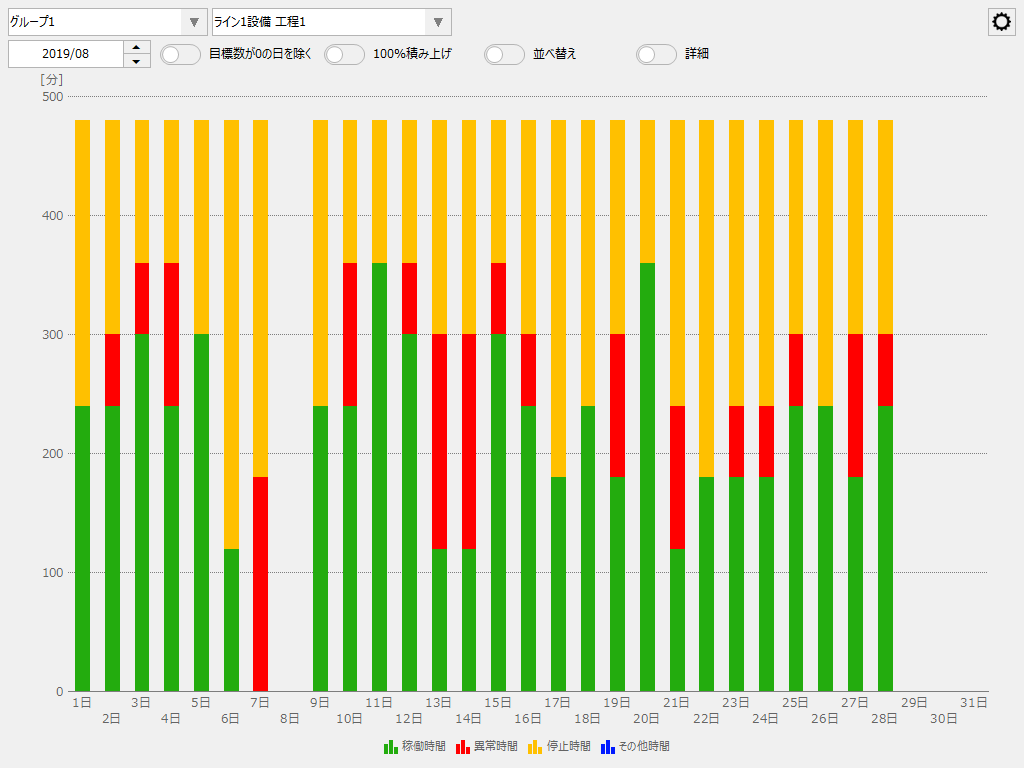
The monthly stacked graph screen displays the equipment operating status on a monthly basis as a stacked graph.
For the year and month selected on the screen, operation time, stop time, abnormal time, and other time for the equipment are displayed in a layered graph. |