About this setting example
This section explains how to select the target alarm from the alarm history, and how to register a trend graph screen call for the related information of the selected alarm ID.
Summary of this configuration example:
•Set related information for the alarm with alarm ID "ALARM-110" and define the settings to call up a trend graph.
•In the trend graph open parameters, set the history display to open the pen group you specified in advance.
View historical trends from alarm ID related information
The setup steps are as follows:
1.Select the target alarm ID in the information bar.
Display the alarm history and select the row for the target alarm (here, select the row for ALARM-110), and click the Update button on the information bar.
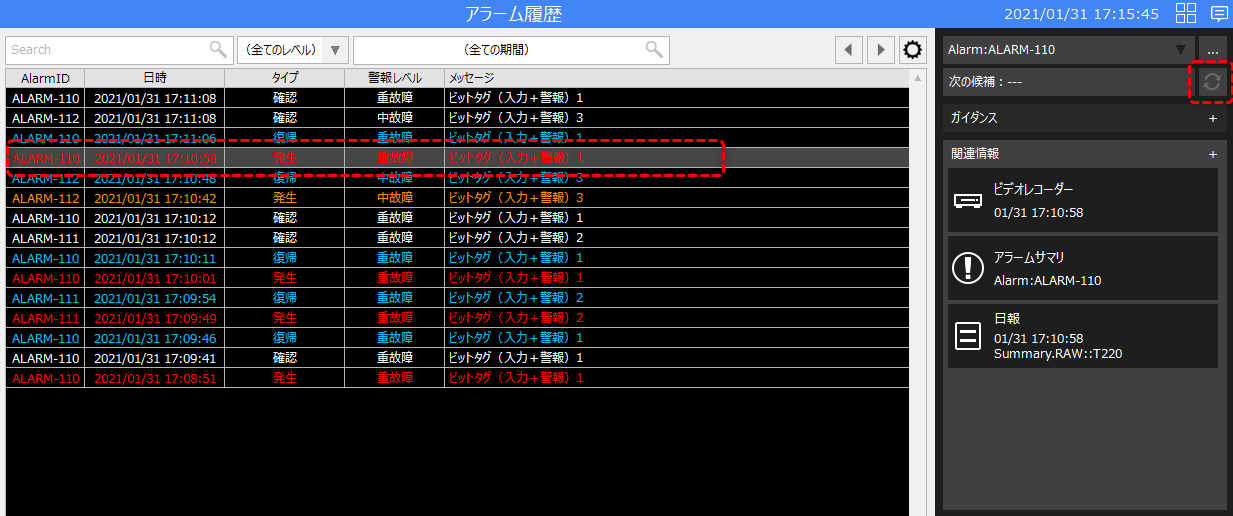
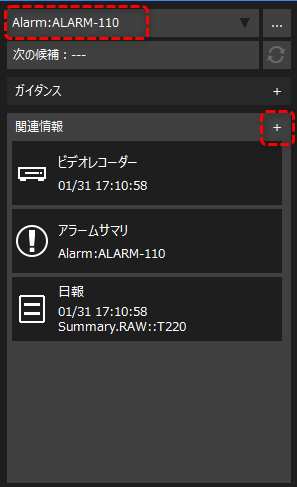
The alarm ID "ALARM-110" will then be selected in the information bar.
|
Click the "+" button for related information on the left.
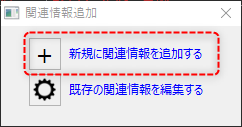
The following confirmation dialog will then be displayed, so select "Add new related information".
This will bring up the Related Information Settings dialog.
|
2.Register related information
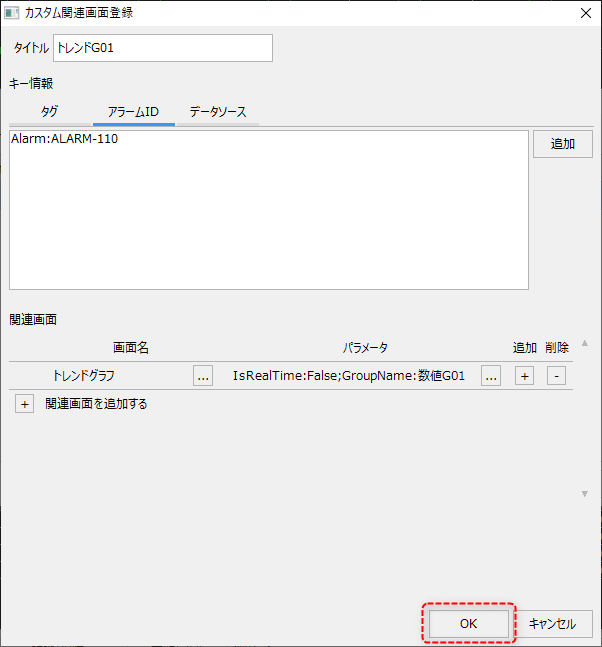
Register related information from the related information settings dialog.
(Related Information Settings Dialog)
|
First, enter a title. In this example, we will use "Trend G01".
Next, set the key information. The alarm ID selected on the alarm history screen is preset for the key information, so use it as is.
|
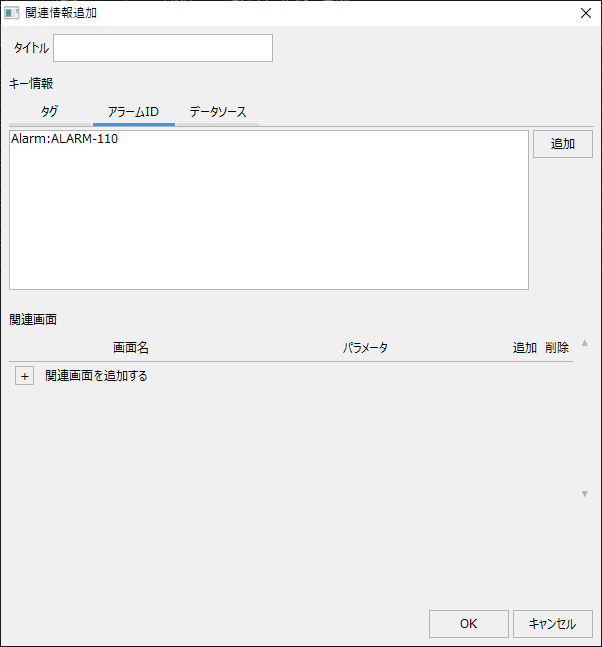

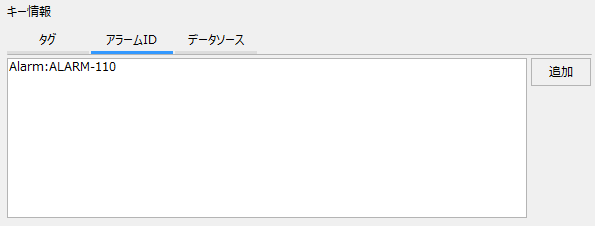
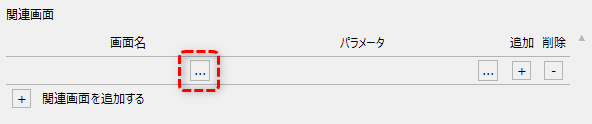
Next, specify the related screen. The screen specified here will be the destination screen for the related information. You can add a row for a related screen by clicking the "+" button next to "Add related screen."
|
|

The following shows the new line added:
|
Clicking the selection button on the left allows you to select the screen to be called from the screen selection dialog.
|
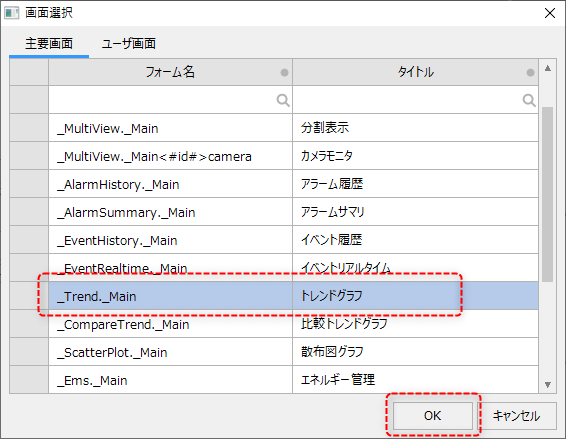
Below is the screen selection dialog.
|
You can select the destination screen from the dialog shown on the left.
This time, we want to call up a trend graph, so select "Trend graph."
|
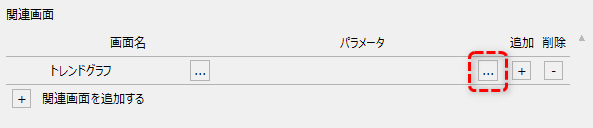
Trend graphs have been added.
|
Next, click the Select Parameters button to set the open parameters for the trend graph.
|
(Parameter setting dialog)
|
You can specify various options for the open parameters of the trend graph. For example, you can directly specify the pen name and data source to be displayed on the graph, or hide the setting button.
As an example, we will make the following settings.
•Group name: "Number G01" •Real-time updates... "False"
When you set the above, the trend graph screen called up from this alarm ID will open with "Numeric G01" selected as the pen group and real-time update turned OFF.
|
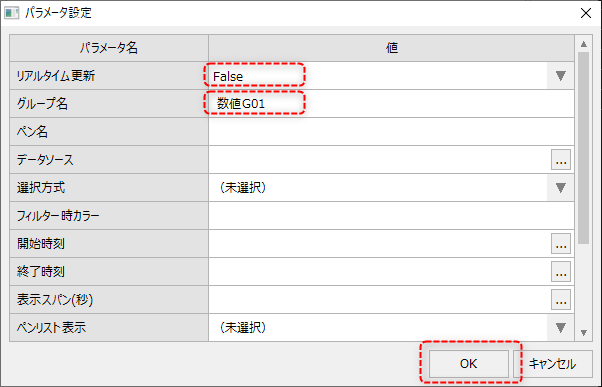
Once you have completed the configuration, click the OK button to save the settings.
3.Operation check
From the alarm history, select the alarm whose occurrence date and time you want to view the historical trend for, and then click the Update button on the information bar.
The newly added related information (the trend graph called "Trend G01") will then be displayed in the related information section of the information bar along with the date and time the alarm occurred.
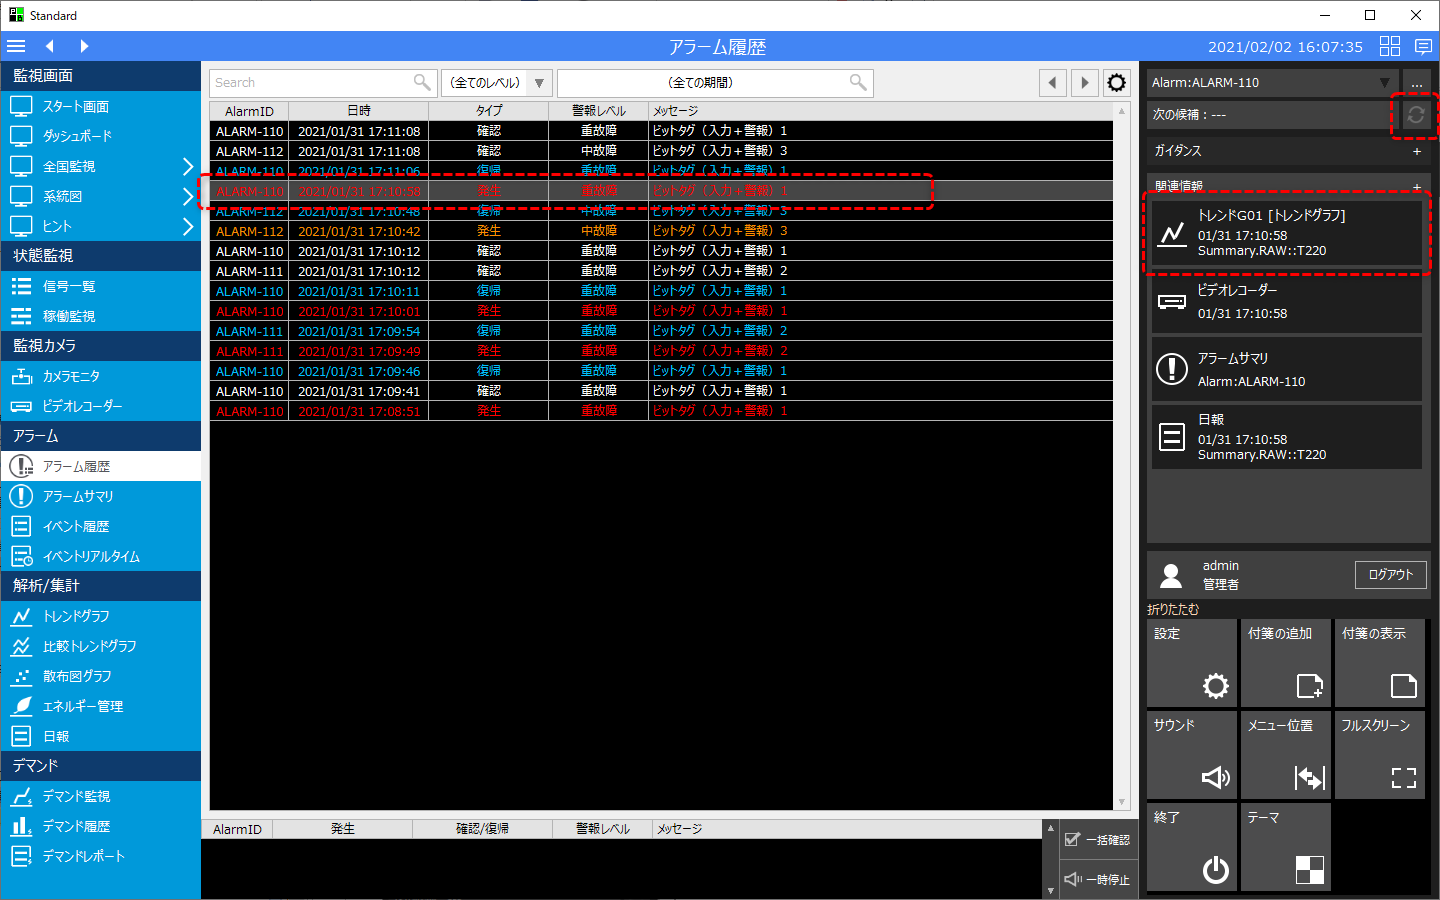
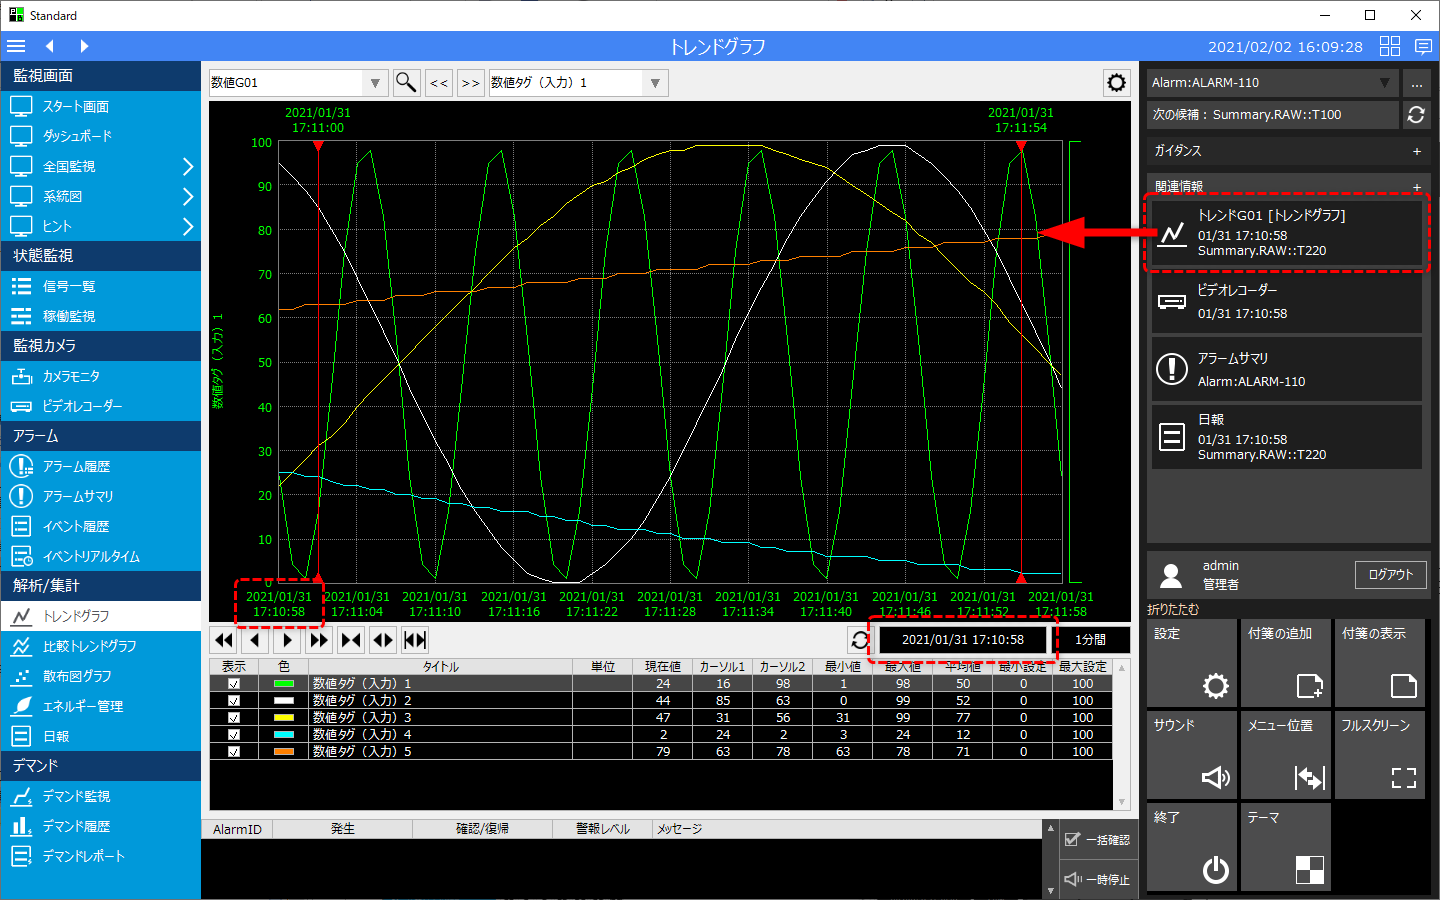
Clicking on related information will display the trend graph screen in the main area. In the displayed trend graph, "Numeric G01" will be selected as the group, and the date and time of the alarm history occurrence will be displayed as the graph start date.
|
You can edit related information that has already been registered and freely add definitions such as tags, alarm IDs, data sources, etc. For information on how to edit related information, see "Editing existing related information". |
