Operation monitoring screen explanation
Operation status monitor
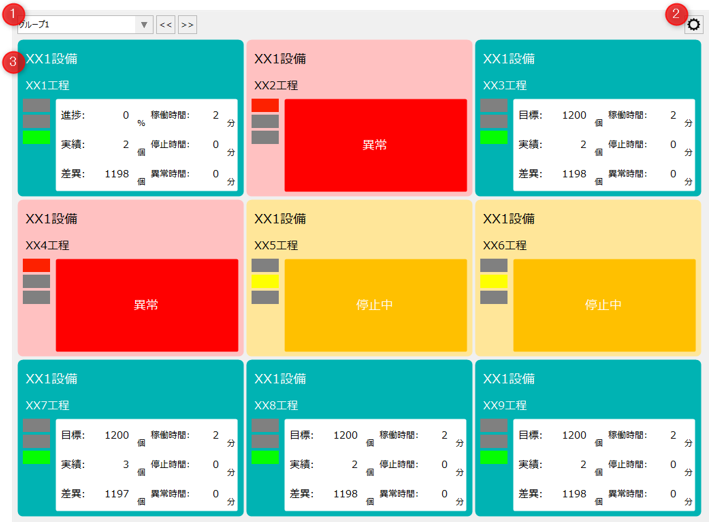
# |
name |
explanation |
||||||||||||
|---|---|---|---|---|---|---|---|---|---|---|---|---|---|---|
1 |
Group Name |
Select the group to display on this screen. Information on each facility registered in the group will be displayed in the monitor area.
|
||||||||||||
2 |
Settings Menu
|
Opens the settings menu. Each time you click the icon, the settings menu will be displayed/hidden. For information on the settings menu, please refer to "Settings Menu".
|
||||||||||||
3 |
Monitor Area
|
The current status of each piece of equipment is displayed in the display pane. Double-clicking on the display pane will display the operation analysis screen for that piece of equipment.
|
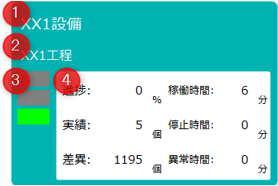
Timeline
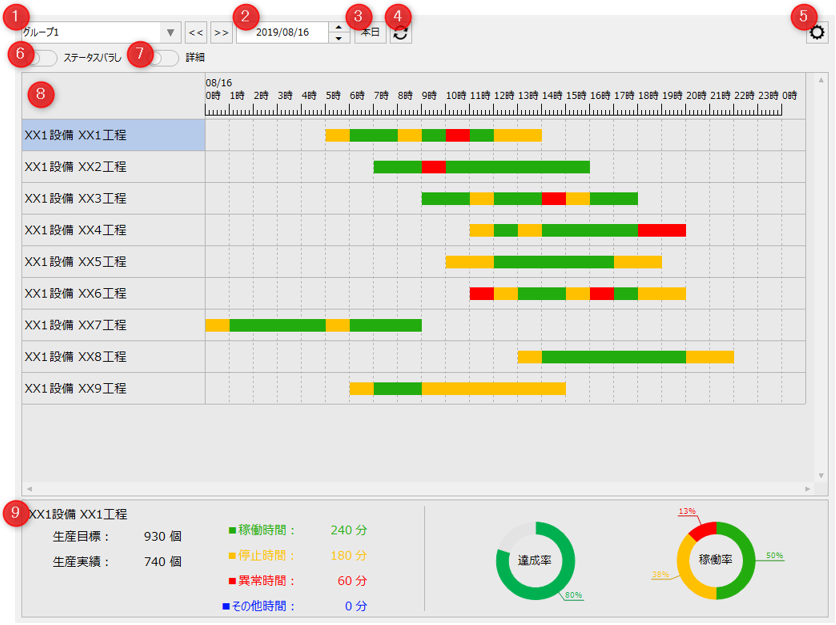
# |
name |
explanation |
|---|---|---|
1 |
Group Name |
Select the group you want to display on this screen. The information of each facility registered in the group will be displayed as a timeline.
|
2 |
Target date
|
Specify the target date for the data to be displayed on this screen.
|
3 |
Today's View
|
The screen display will be updated with today as the target date.
|
4 |
Screen Update
|
The screen will be updated with the latest data for the selected date.
|
5 |
Settings Menu
|
Opens the settings menu. For information about the settings menu, see "Settings Menu".
|
6 |
Status Breakdown
|
Breaks down the timeline into separate elements and displays them as separate bars.
(Display example)
|
7 |
detail
|
Displays a breakdown of aggregated categories on the timeline display.
(Display example)
|
8 |
Timeline display area
|
The operating status of each piece of equipment registered in the group is displayed as a timeline (Gantt chart). Select and double-click a row to display the operation analysis screen for that equipment.
|
9 |
Equipment data display area
|
Displays information on the currently selected facility. The following data is displayed according to the details display switching in 7 above.
Details OFF: Target number, production number, operation time, downtime, abnormal time, other time, achievement rate, operation rate
When Details is ON: Target number, production number, legend display (displays the legend of the display color of the Gantt chart when detailed display is displayed)
|


Operational track record
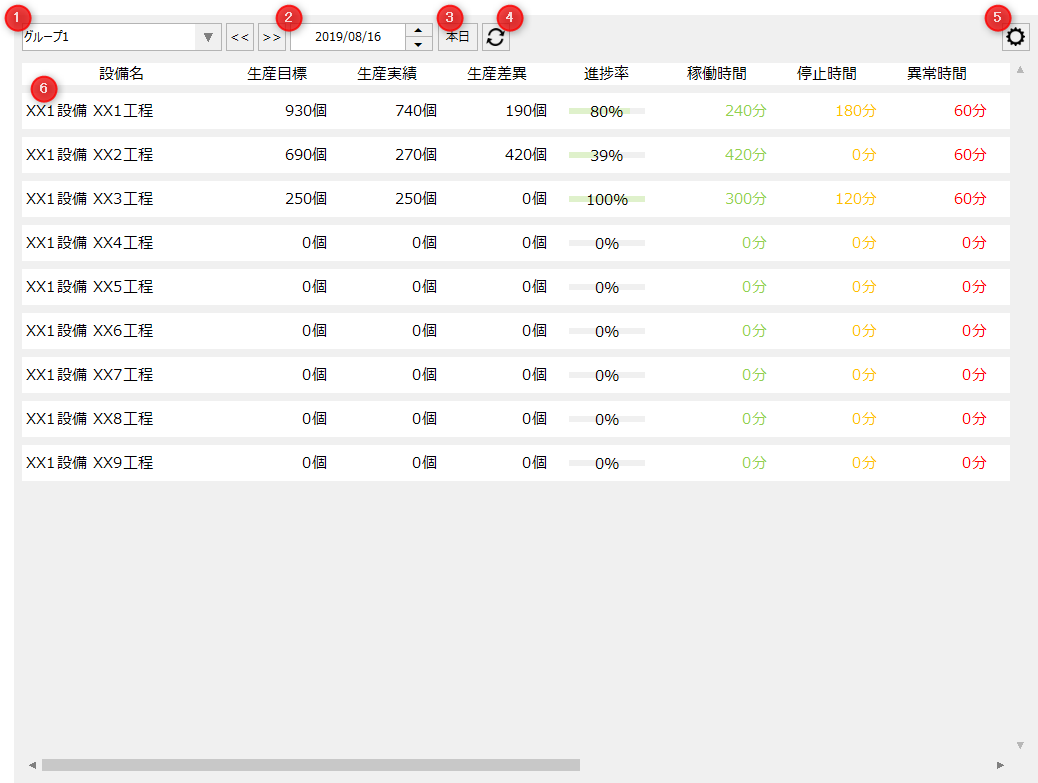
# |
name |
explanation |
|---|---|---|
1 |
Group Name |
Select the group you want to display on this screen. Information about each facility registered in the group will be displayed in list format.
|
2 |
Target date
|
Specify the target date for the data to be displayed on this screen.
|
3 |
Today's View
|
The screen display will be updated with today as the target date.
|
4 |
Screen Update
|
The screen will be updated with the latest data for the selected date.
|
5 |
Settings Menu
|
Opens the settings menu. For information about the settings menu, see "Settings Menu".
|
6 |
List display area
|
The operation results of each piece of equipment registered in the group are displayed in a list format. Select a row and double-click to display the operation analysis screen for that piece of equipment. In addition, in the settings screen, "Operational performance display items" you can select the display items, change the display order, display width, etc.
|
Operation Analysis
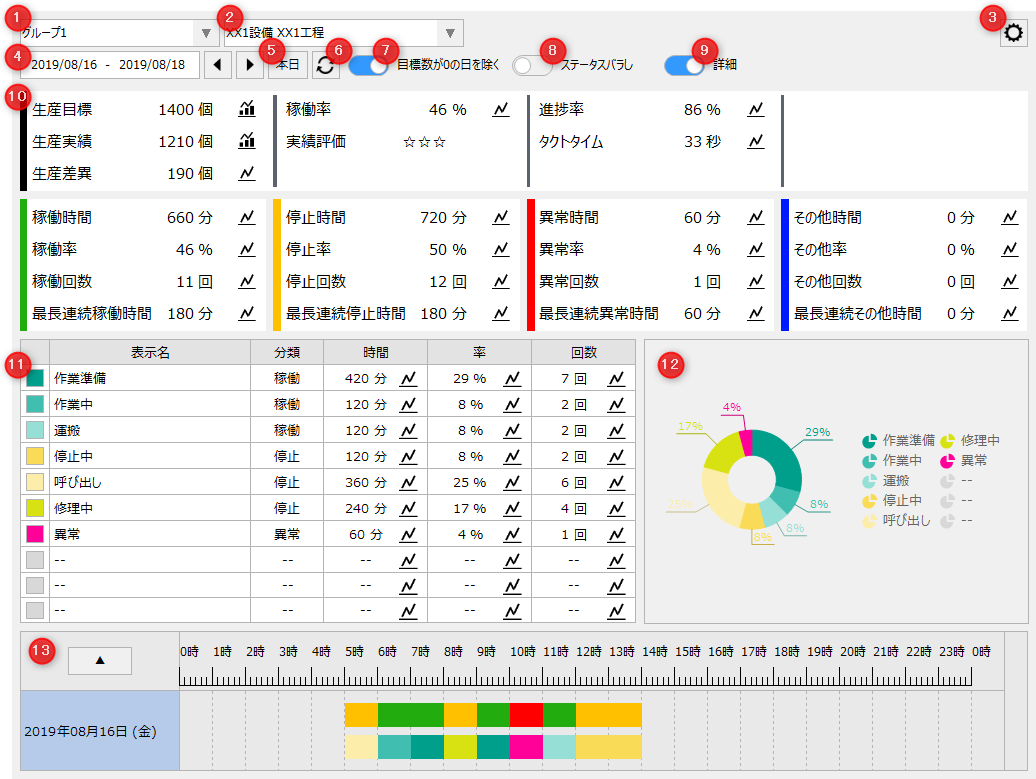
# |
name |
explanation |
||
|---|---|---|---|---|
1 |
Group Name
|
Select the group to be displayed on this screen.
|
||
2 |
Target equipment
|
Select the facilities to be displayed on this screen.
|
||
3 |
Settings Menu
|
Opens the settings menu. For information about the settings menu, see "Settings Menu".
|
||
4 |
Target date
|
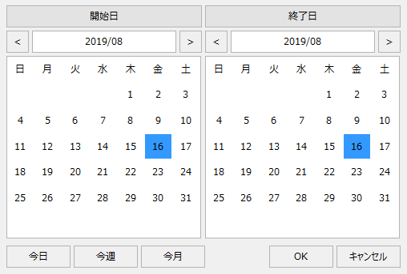
Specify the date range for the data to be displayed on this screen.
When you click the date input box, the following selection dialog will be displayed.
(Date selection dialog)
Click the "◀" or "▶" button to change the date within the width of the selection range.
Example: If you click the "◀" button while selecting 2019/08/01 - 2019/08/31, 2019/07/01 - 2019/07/31 will be selected. Example: If you select 2019/08/01 - 2019/08/31 and click the "▶" button, 2019/09/01 - 2019/09/30 will be selected.
|
||
5 |
Today's View
|
The screen display will be updated with today as the target date.
|
||
6 |
Screen Update
|
The screen will be updated with the latest data for the selected date.
|
||
7 |
Excluding days with a target date of 0
|
If you turn this setting ON, you can exclude data for days when the production target is set to 0 from the aggregated data displayed.
|
||
8 |
Status Breakdown
|
Breaks down the timeline into separate elements and displays them as separate bars.
(Display example)
|
||
9 |
detail
|
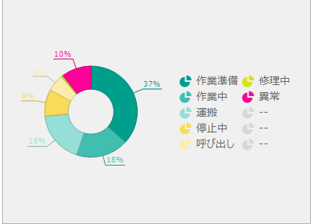
Displays a breakdown of aggregated categories on the timeline display.
(Display example)
|
||
10 |
Operational performance display area
|
Displays the aggregated data of the operation results for the displayed period for the target equipment.
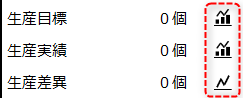
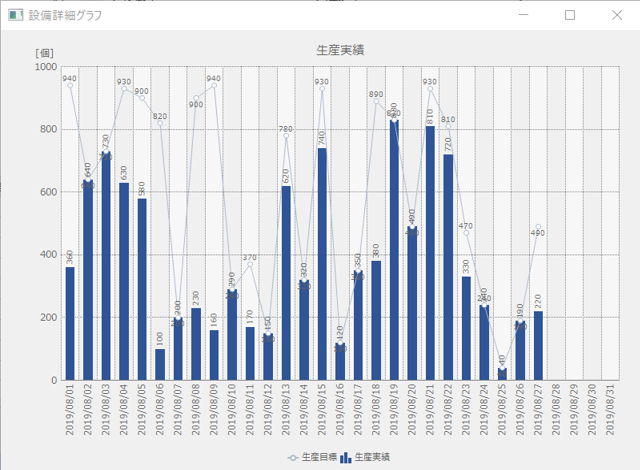
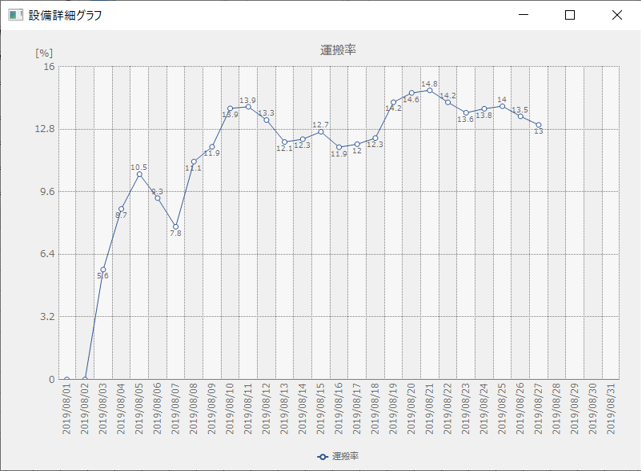
Clicking on the graph icon to the right of each displayed data will display a popup with detailed equipment graphs of the target data.
(Equipment details graph)
|
||
11 |
Details display area |
Displays detailed data for each operating state.
Clicking on the graph icon to the right of each displayed data will display a popup with detailed equipment graphs of the target data.
(Equipment details graph)
|
||
12 |
Graph display area |
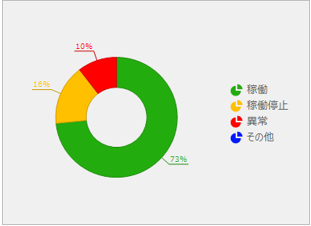
Displays the percentage of operating time in a pie chart.
|
||
13 |
Timeline display area |
View the timeline.
Clicking the button below will hide the other display areas and enlarge the timeline display area. Clicking the same button again will return the display area to its original size.
(Expanded timeline display area)
|




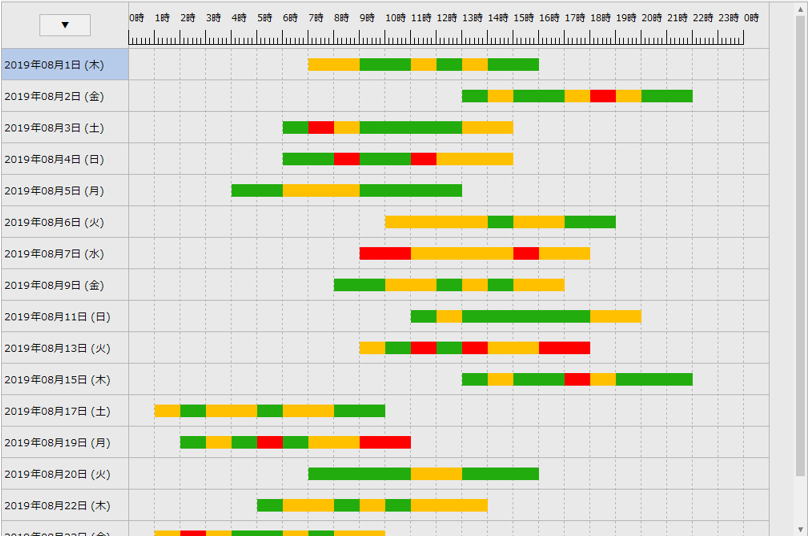
Monthly Report Timeline
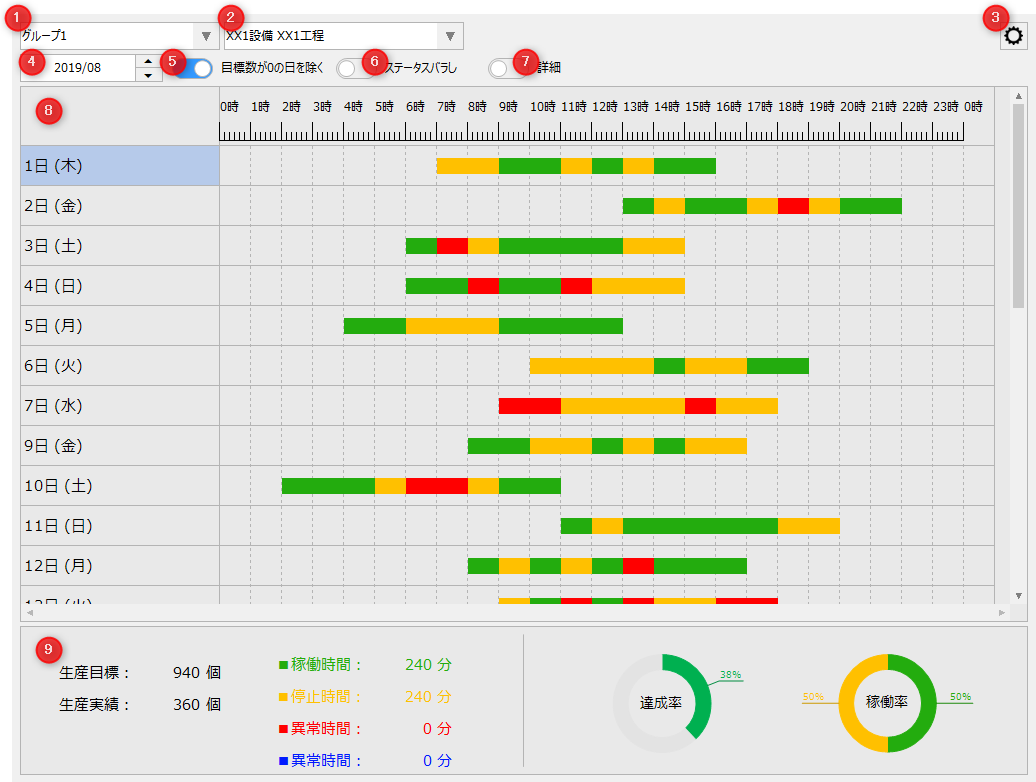
# |
name |
explanation |
|---|---|---|
1 |
Group Name
|
Select the group to be displayed on this screen.
|
2 |
Target equipment
|
Select the facilities to be displayed on this screen.
|
3 |
Settings Menu
|
Opens the settings menu. For information about the settings menu, see "Settings Menu".
|
4 |
Target month
|
Specify the month for which data is to be displayed on this screen.
|
5 |
Excluding days with a target date of 0
|
If you turn this setting ON, you can exclude data for days when the production target is set to 0 from the aggregated data displayed.
|
6 |
Status Breakdown
|
Breaks down the timeline into separate elements and displays them as separate bars.
(Display example)
|
7 |
detail
|
Displays a breakdown of aggregated categories on the timeline display.
(Display example)
|
8 |
Timeline display area
|
Displays a one-month timeline of the target facility.
|
9 |
Equipment data display area
|
Displays one month's aggregated information for the currently selected facility. The following data is displayed according to the details display switching in 7 above.
Details OFF: Target number, production number, operation time, downtime, abnormal time, other time, achievement rate, operation rate
When Details is ON: Target number, production number, legend display (displays the legend of the display color of the Gantt chart when detailed display is displayed)
|


Monthly operation results
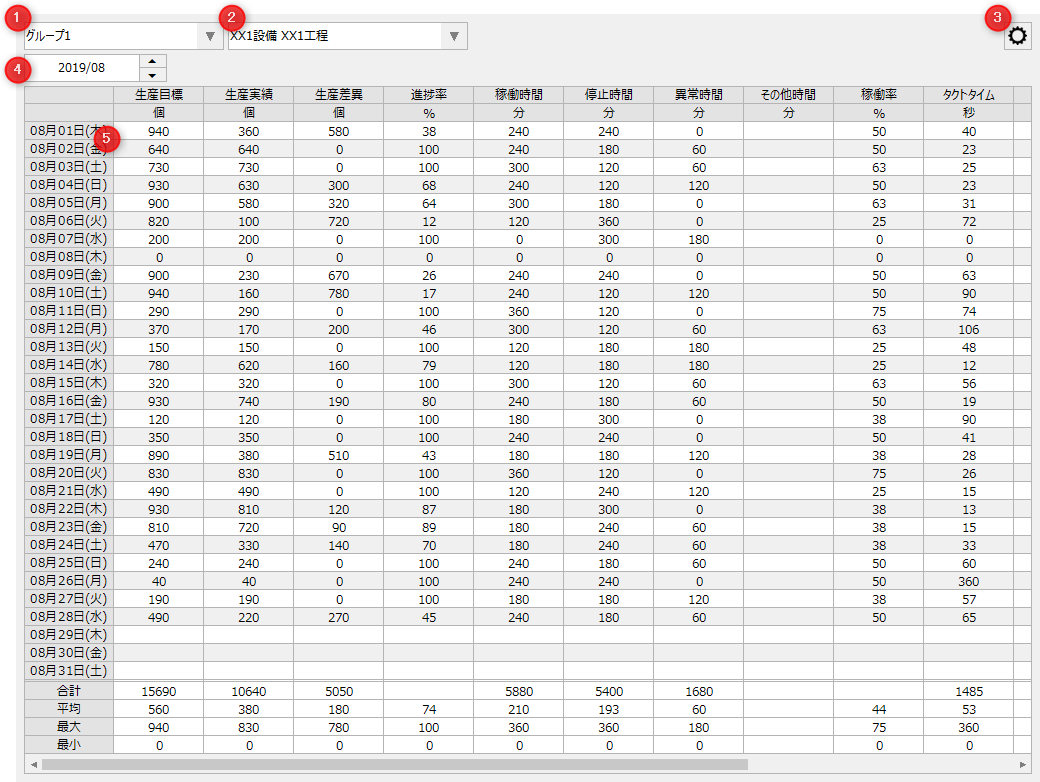
# |
name |
explanation |
|---|---|---|
1 |
Group Name |
Select the group to be displayed on this screen.
|
2 |
Target equipment
|
Select the facilities to be displayed on this screen.
|
3 |
Settings Menu
|
Opens the settings menu. For information about the settings menu, see "Settings Menu".
|
4 |
Target month
|
Specify the month for which data is to be displayed on this screen.
|
5 |
List display area
|
Displays the monthly summary data of the operation results of the target equipment in list format. Double-clicking on a displayed data row will display the operation analysis screen for that equipment and that date.
|
Monthly Bar Graph
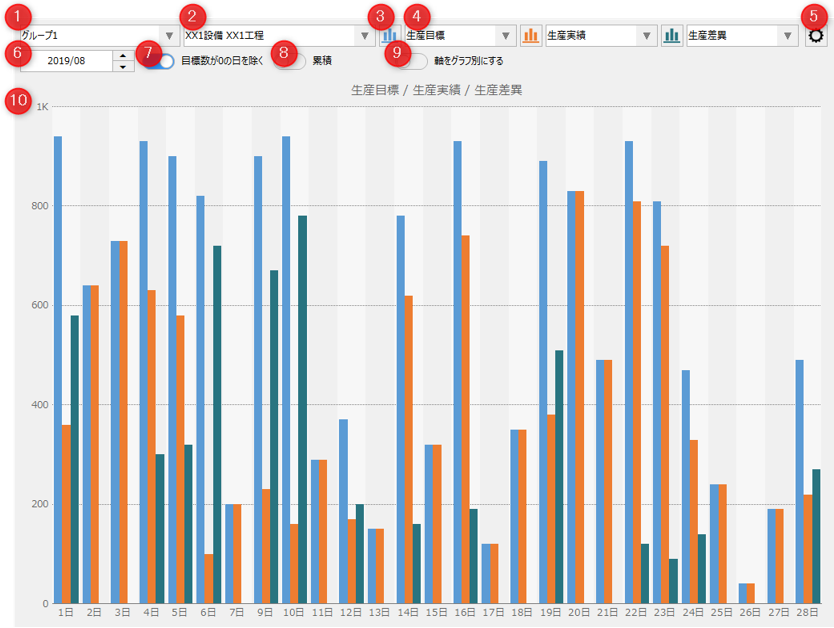
# |
name |
explanation |
||||||
|---|---|---|---|---|---|---|---|---|
1 |
Group Name
|
Select the group to be displayed on this screen.
|
||||||
2 |
Target equipment
|
Select the facilities to be displayed on this screen.
|
||||||
3 |
Graph Type |
Select the type of graph to display. Click the icon to switch the graph type.
|
||||||
4 |
Monitoring items |
Select the data items for each series to be displayed in the graph display area.
|
||||||
5 |
Settings Menu
|
Opens the settings menu. For information about the settings menu, see "Settings Menu".
|
||||||
6 |
Target month
|
Specify the month for which data is to be displayed on this screen.
|
||||||
7 |
Excluding days with a target date of 0
|
If you turn this setting ON, you can exclude data for days when the production target is set to 0 from the aggregated data displayed.
|
||||||
8 |
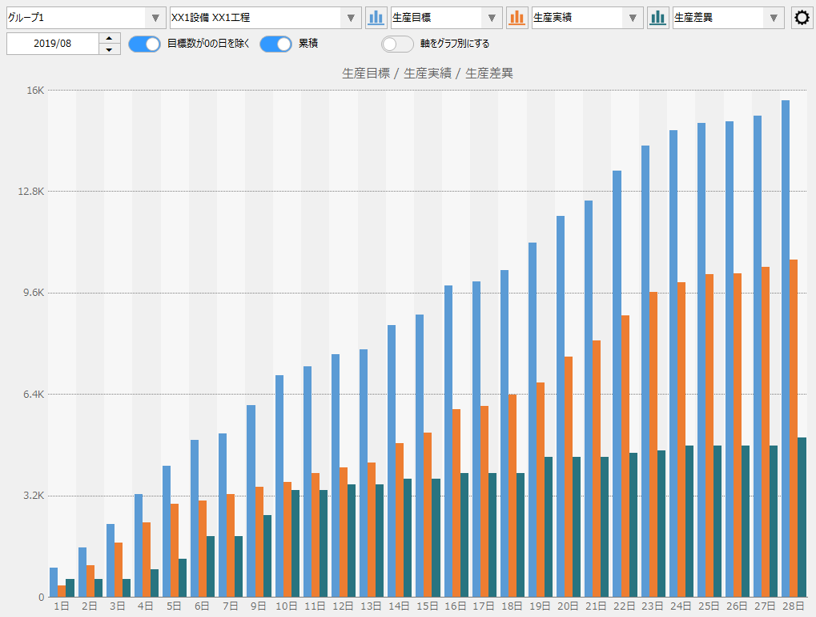
Cumulative |
When this setting is turned ON, the graph will display cumulative totals.
(Cumulative graph display)
|
||||||
9 |
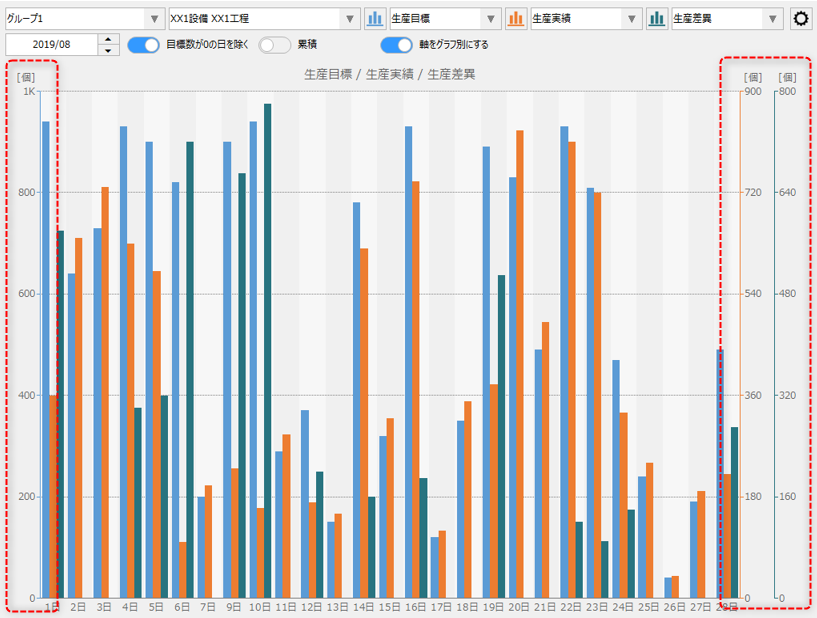
Make the axis a different graph
|
When this setting is ON, the graph axes are displayed separately for each graph. When displayed separately for each graph, the axis for the first series data item is displayed on the left, and the axes for the second and third series data items are displayed on the right.
(Axis display for each graph)
|
||||||
10 |
Graph display area
|
Displays one month's aggregated data for the currently selected facility in a bar graph.
|


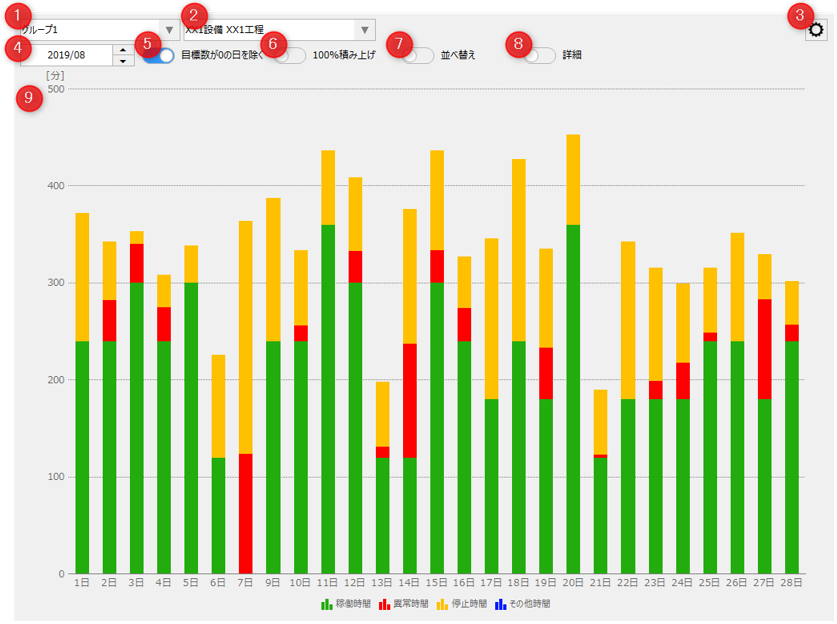
Monthly stacked graph
# |
name |
explanation |
|---|---|---|
1 |
Group Name
|
Select the group to be displayed on this screen.
|
2 |
Target equipment
|
Select the facilities to be displayed on this screen.
|
3 |
Settings Menu
|
Opens the settings menu. For information about the settings menu, see "Settings Menu".
|
4 |
Target month
|
Specify the month for which data is to be displayed on this screen.
|
5 |
Excluding days with a target date of 0
|
If you turn this setting ON, you can exclude data for days when the production target is set to 0 from the aggregated data displayed.
|
6 |
100% stacked
|
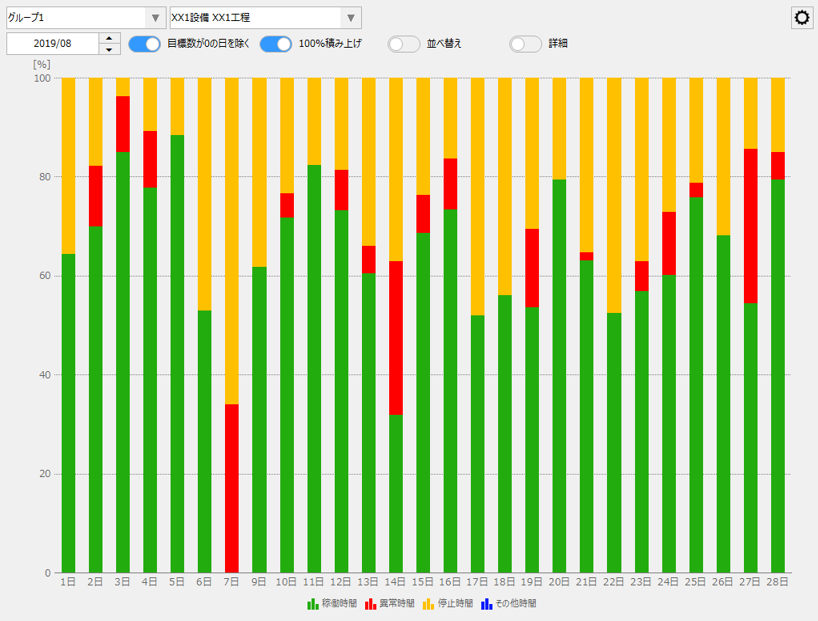
When this setting is turned on, the graph will be displayed as a 100% stacked graph.
(100% stacked view)
|
7 |
Sorting
|
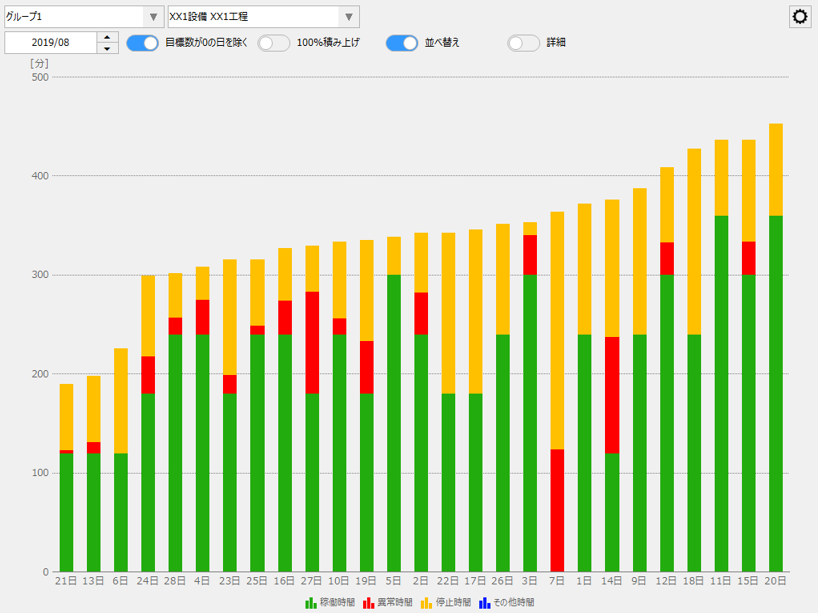
When this setting is turned ON, the graph will be displayed in ascending order of daily total data.
(Graph sorting display)
|
8 |
detail
|
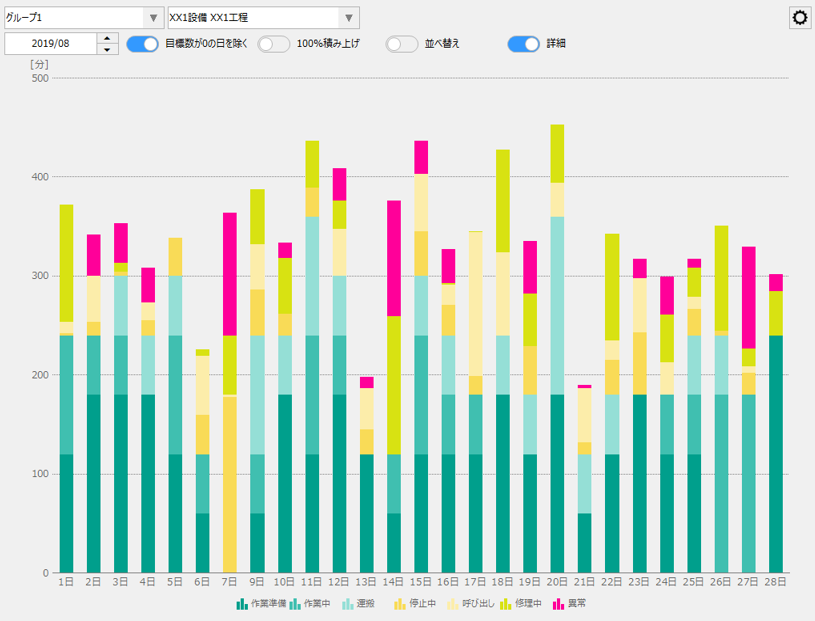
When this setting is ON, the graph details will be displayed as aggregated data for each operating status. In the case of OFF, the data will be displayed as aggregated data for each aggregation category.
(Graph details display)
|
9 |
Graph display area
|
Displays one month's aggregated data for the currently selected facility in a bar graph.
Clicking on the legend at the bottom of the graph will allow you to show/hide the graph for that lineage.
|